
Analytics drilldowns and comparisons
Analytics is not only a dashboard. Most tables and charts are entry points into narrower views, so you can move from agency-wide performance into a specific artist, booker, venue, organizer, city, or country.
Main lenses
| Lens | What to use it for |
|---|---|
| Overview | Agency-wide KPIs, monthly trend, revenue by artist and booker, and top venues. |
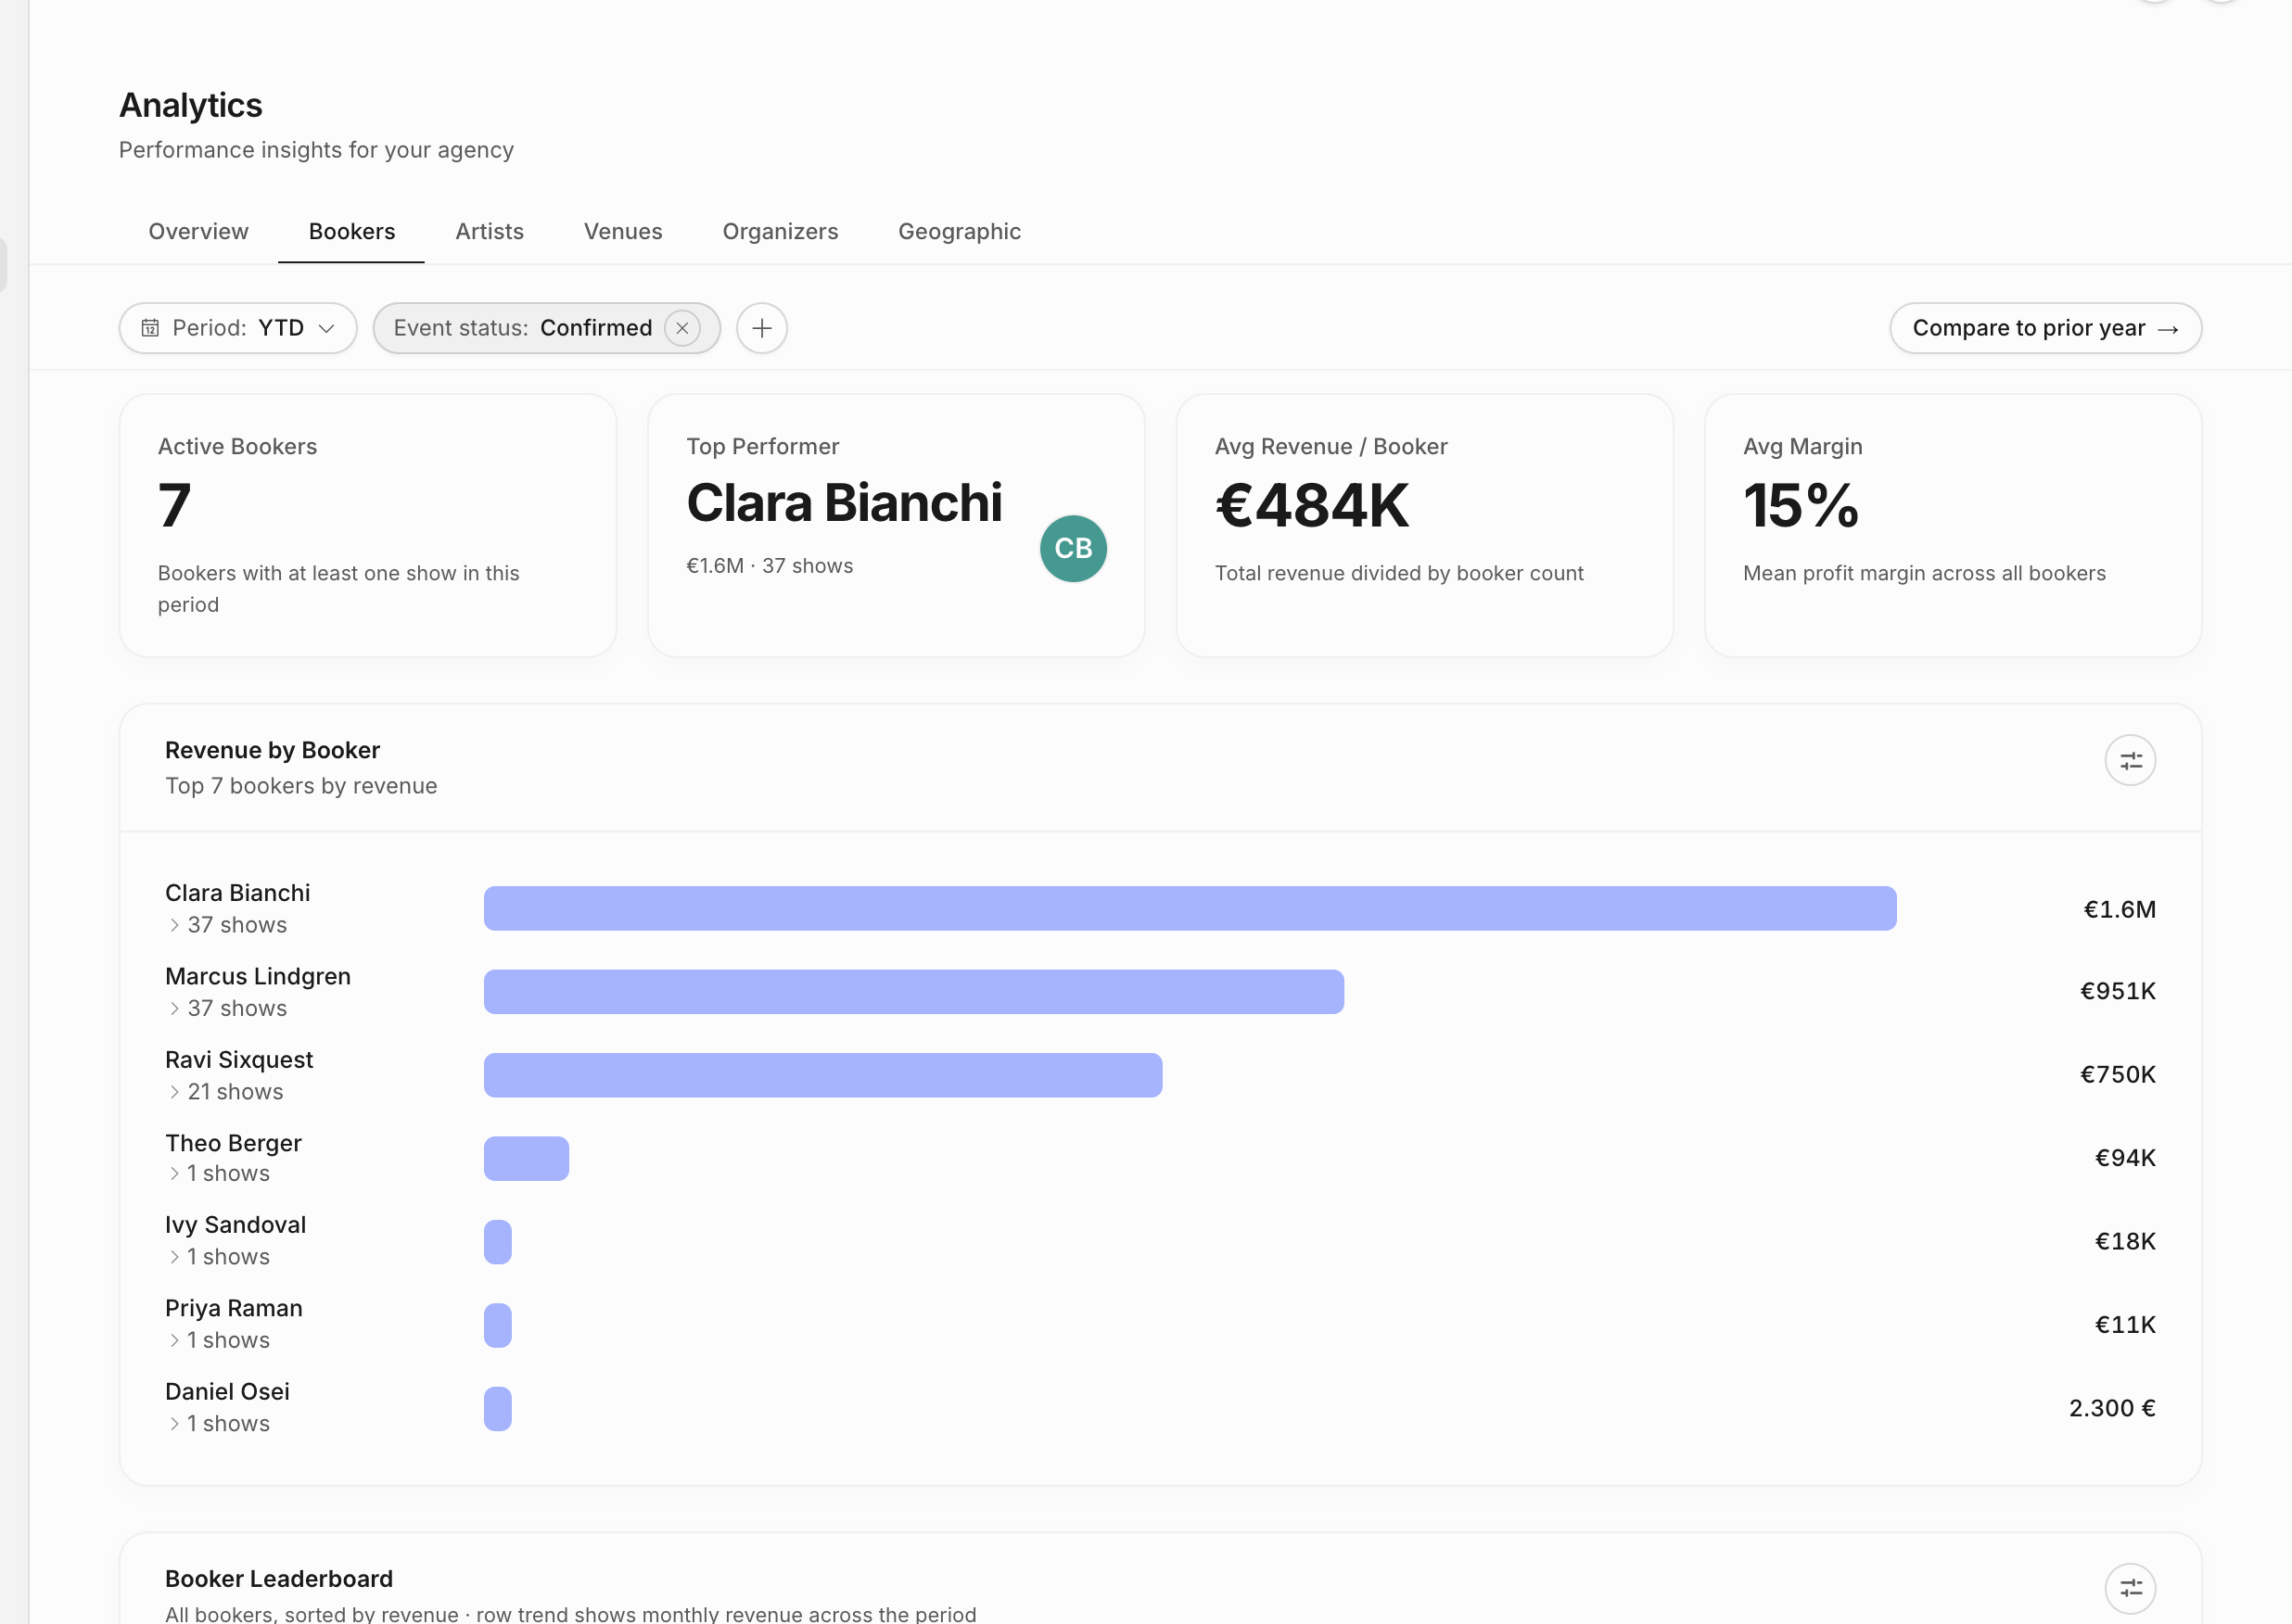
| Bookers | Booker KPI cards, revenue by booker, leaderboard, efficiency chart, monthly booker trends, and deal-size distribution. |
| Artists | Artist KPI cards, roster table, revenue by artist, new versus repeat artist revenue, ROI scatter, concentration, tier mix, genre revenue, and per-artist trends. |
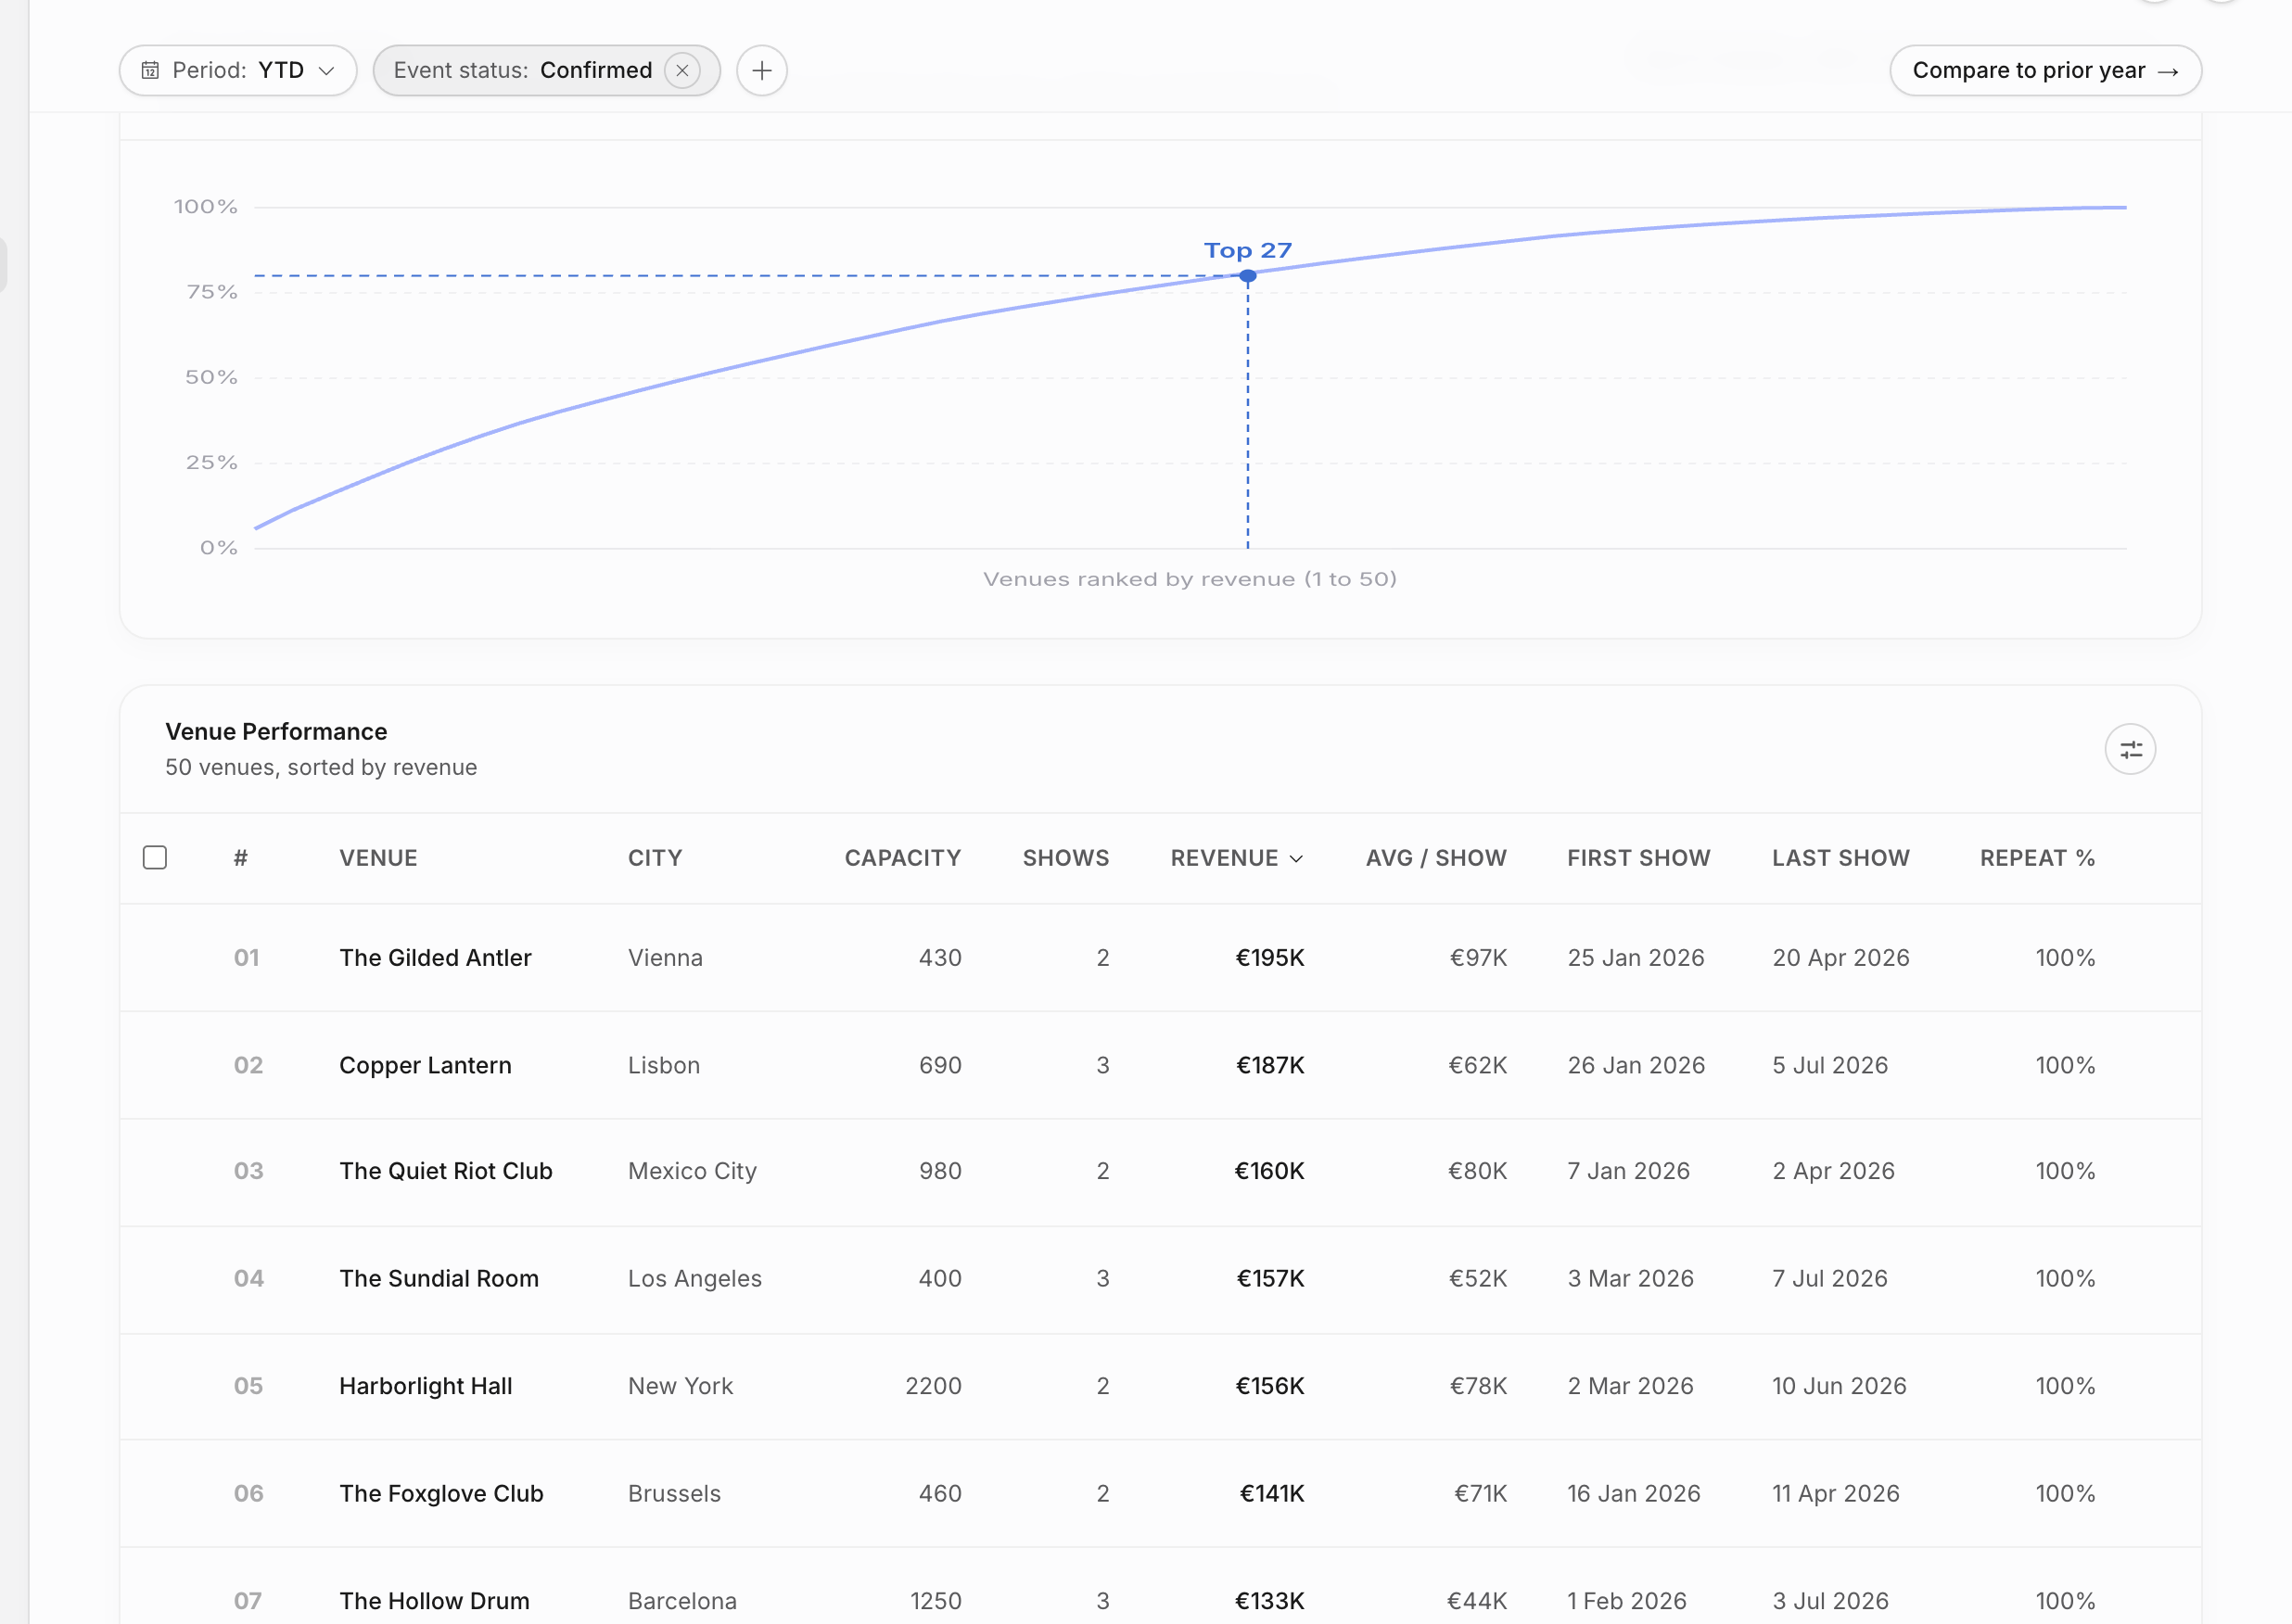
| Venues | Venue KPI cards, repeat-rate signals, revenue by city, new versus repeat venue revenue, concentration, and deep venue table. |
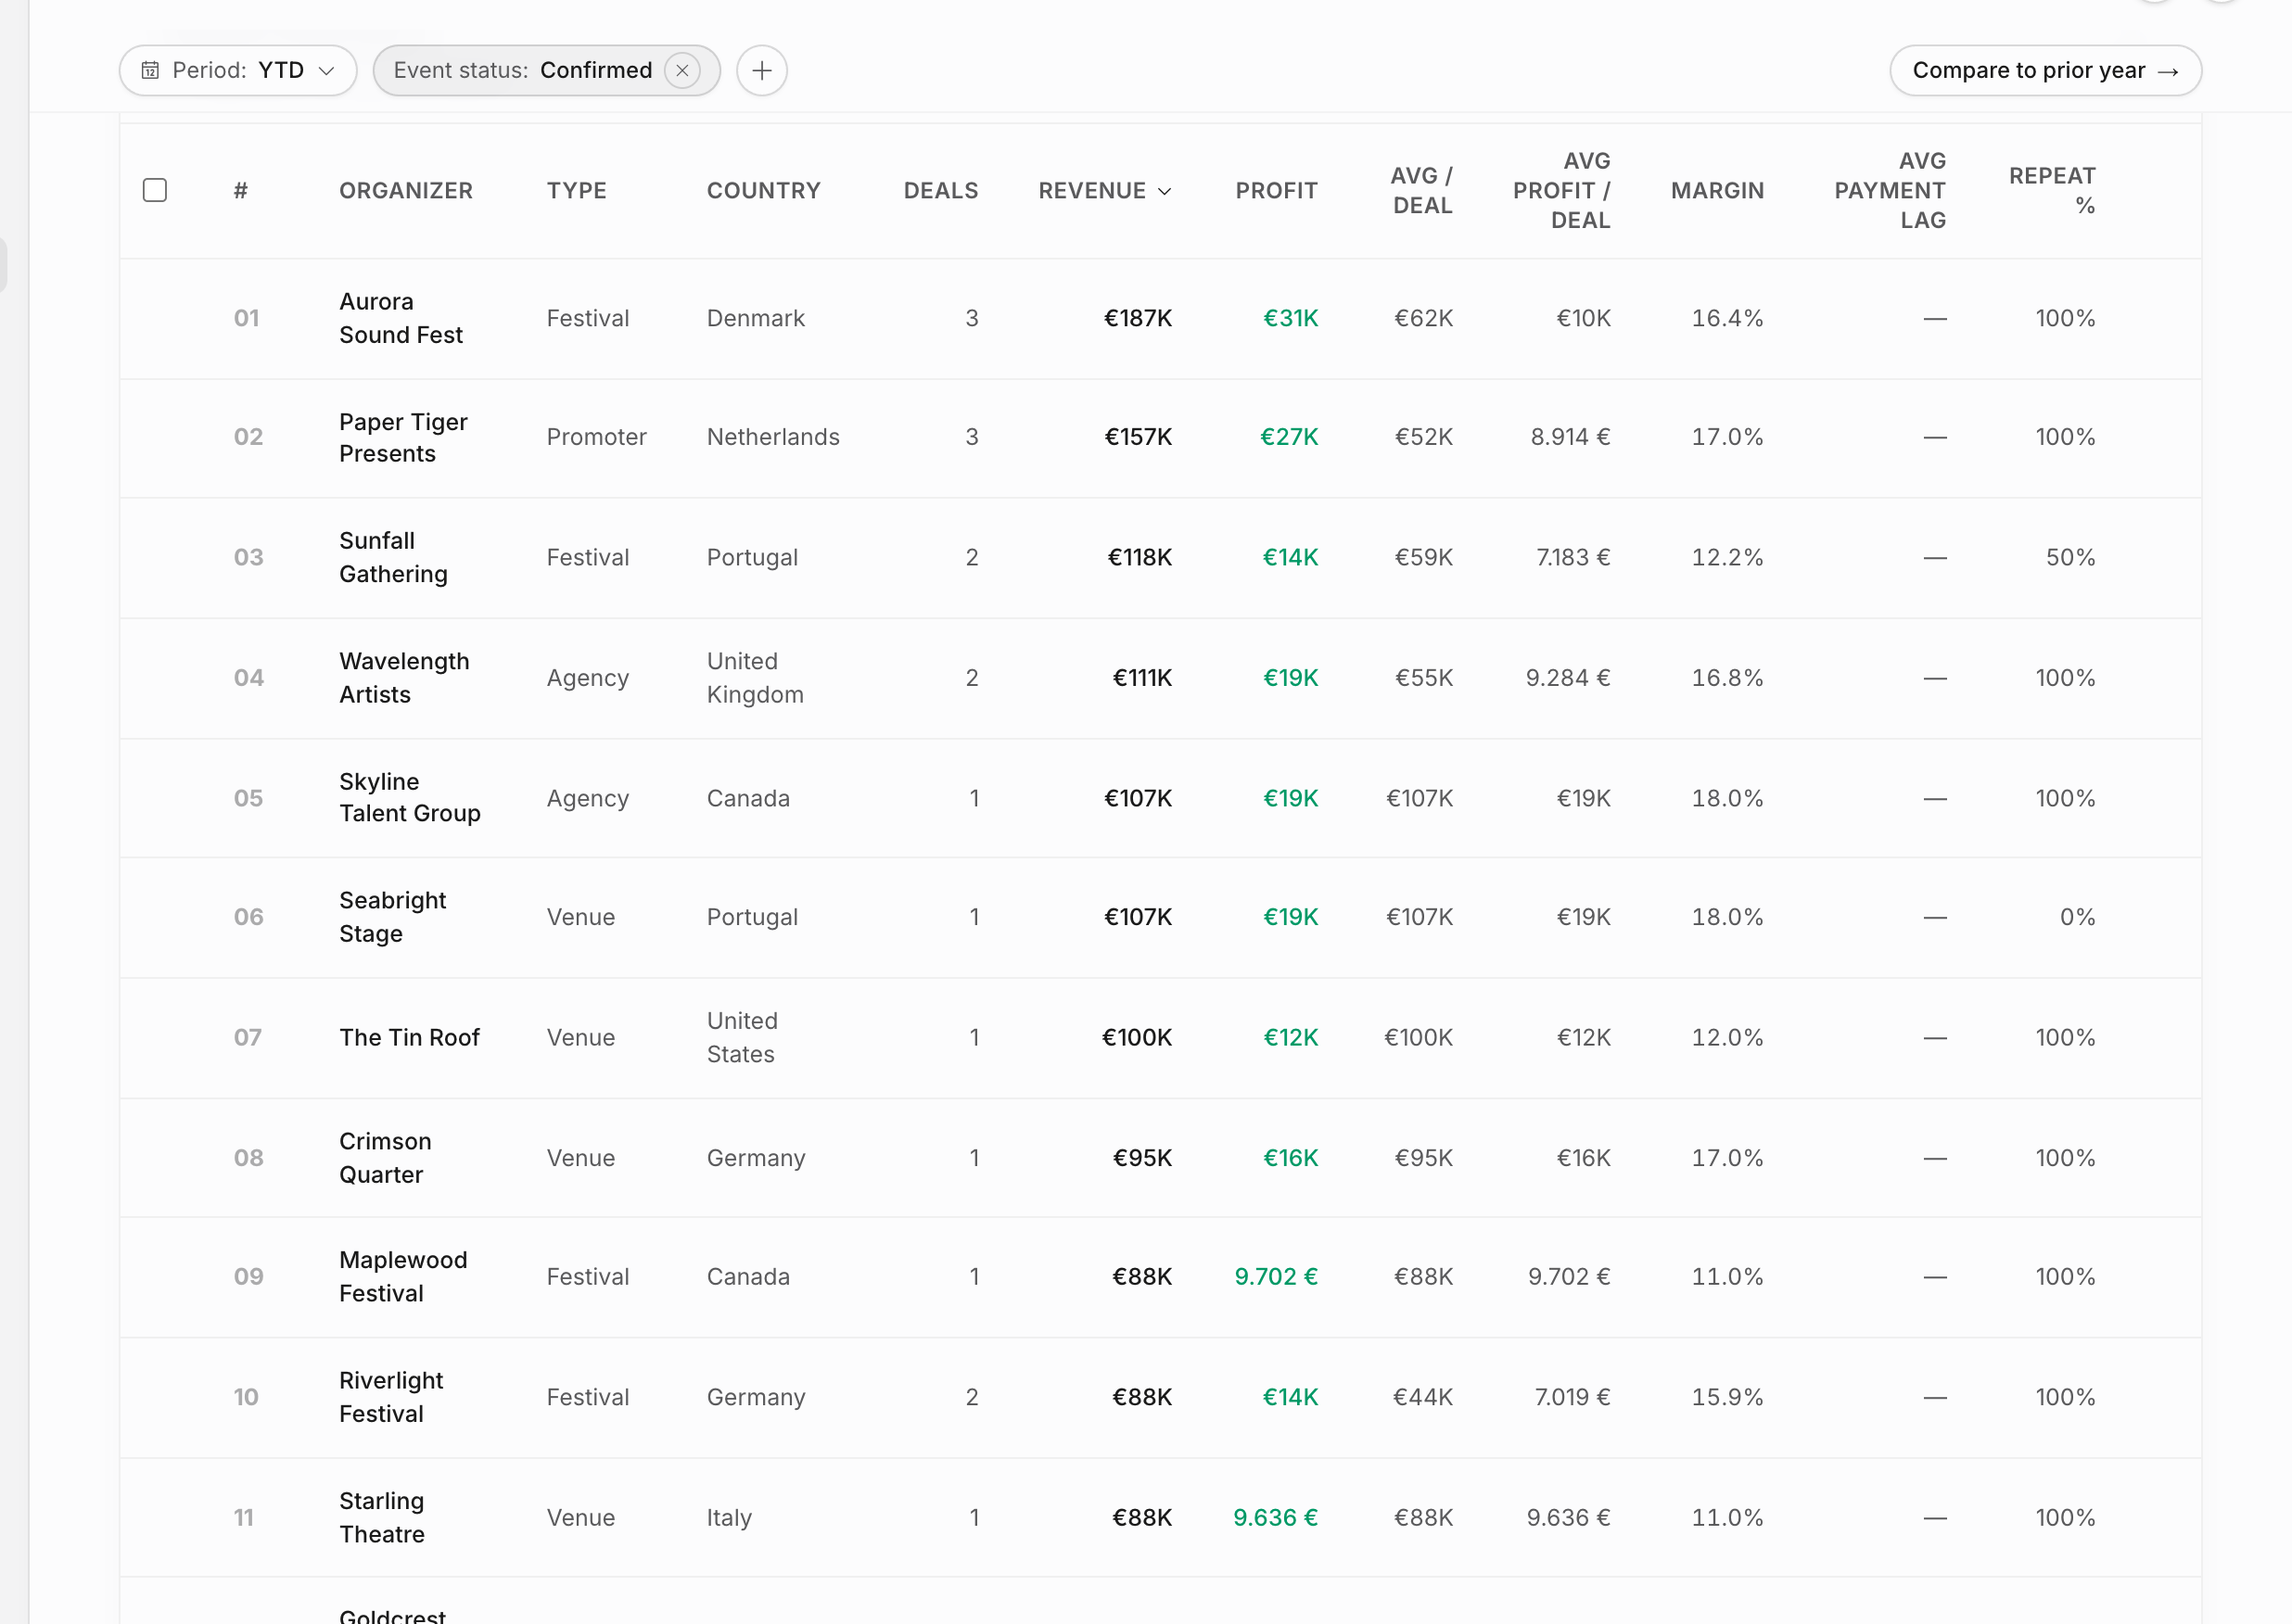
| Organizers | Organizer KPI cards, organizer concentration, deep organizer table, repeat behavior, payment health, payment lag, and deal health. |
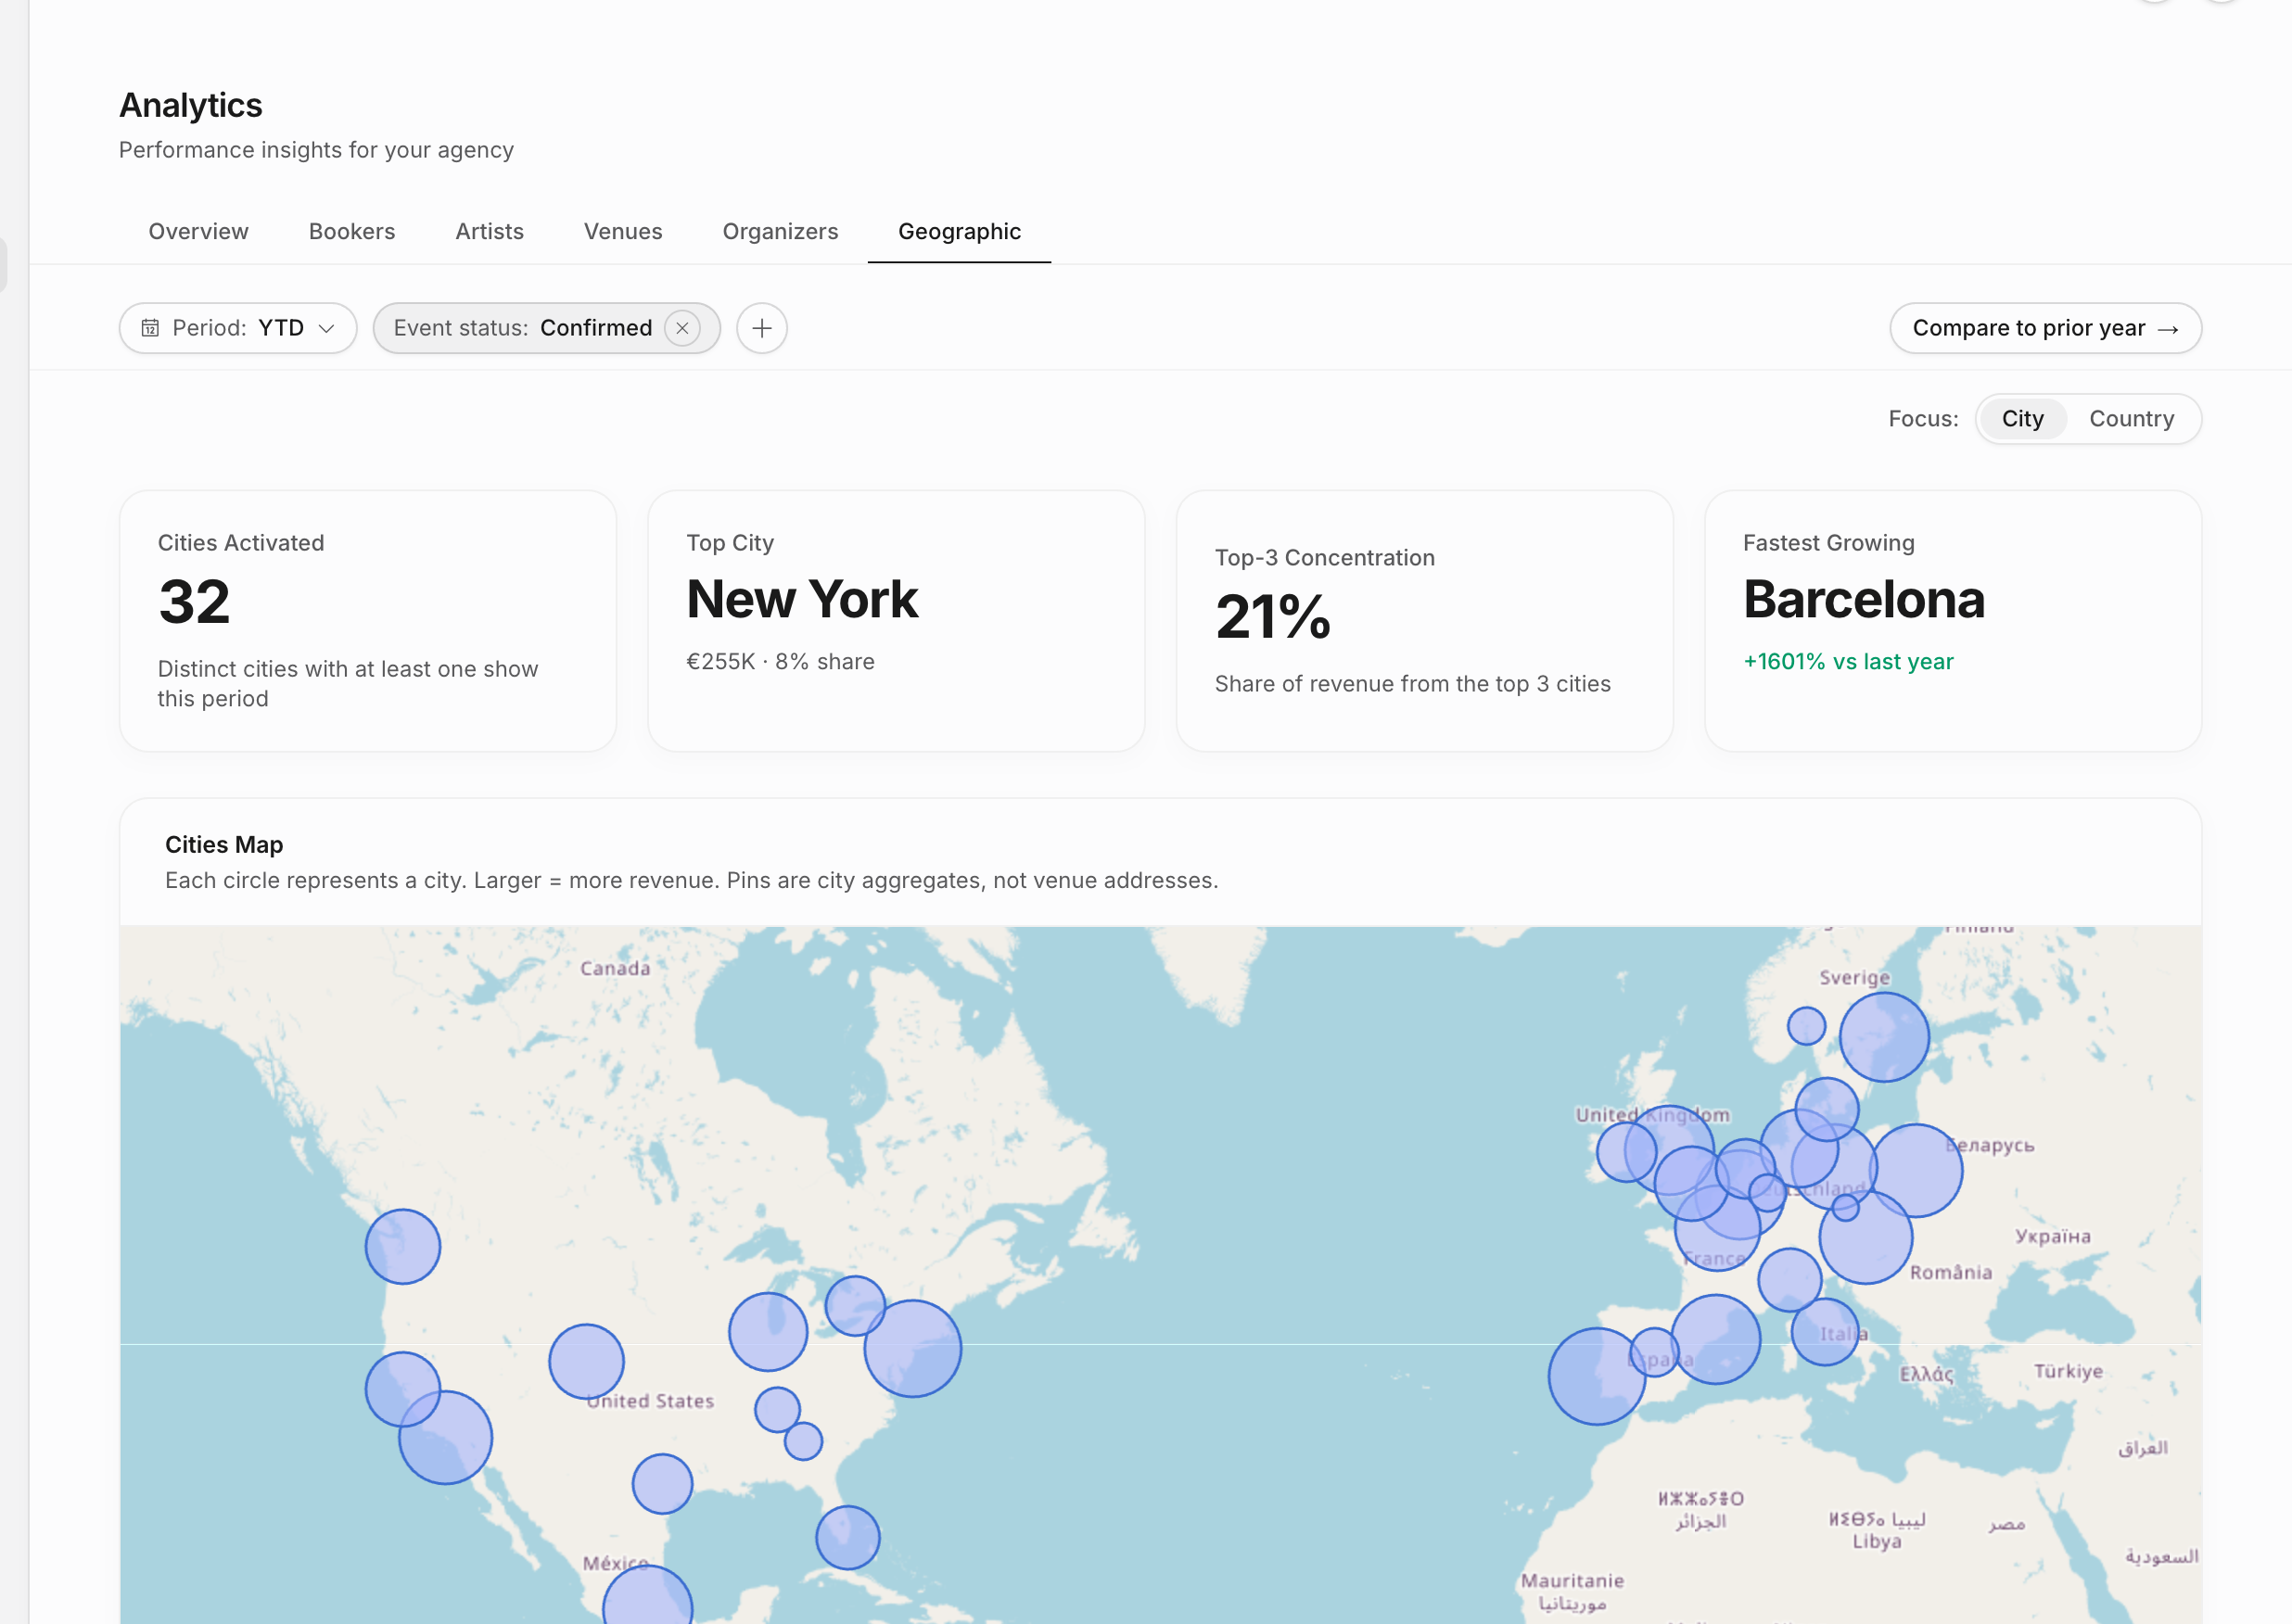
| Geographic | City and country focus, regional KPIs, map, revenue bars, concentration over time, market growth tables, and all-region table. |
The filter bar stays with you across these lenses. Period, event status, invoice status, per-event revenue range, artist, booker, country, organizer type, and capacity filters change the numbers and are preserved when you open supported compare pages.
The default event-status filter is confirmed events. Clearing or changing it can make draft, pending, or cancelled records appear in analytics if the current user has access to them.
Detail pages
Open a row when you need the story behind a ranking. Detail pages keep the same analytics scope and show only records the current user is allowed to see.
| Detail page | What it shows |
|---|---|
| Artist | KPIs, period trend, top venues, top cities, top bookers, and the underlying show list. |
| Booker | KPIs, period trend, top artists, top organizers, top venues, top cities, and booked shows. |
| Venue | KPIs, map context, and the shows connected to that venue. |
| Organizer | KPIs and the deal list for that organizer. |
| City | KPIs, map context, venue table, and shows in that city. |
| Country | KPIs, map context, top cities or venues, and shows in that country. |
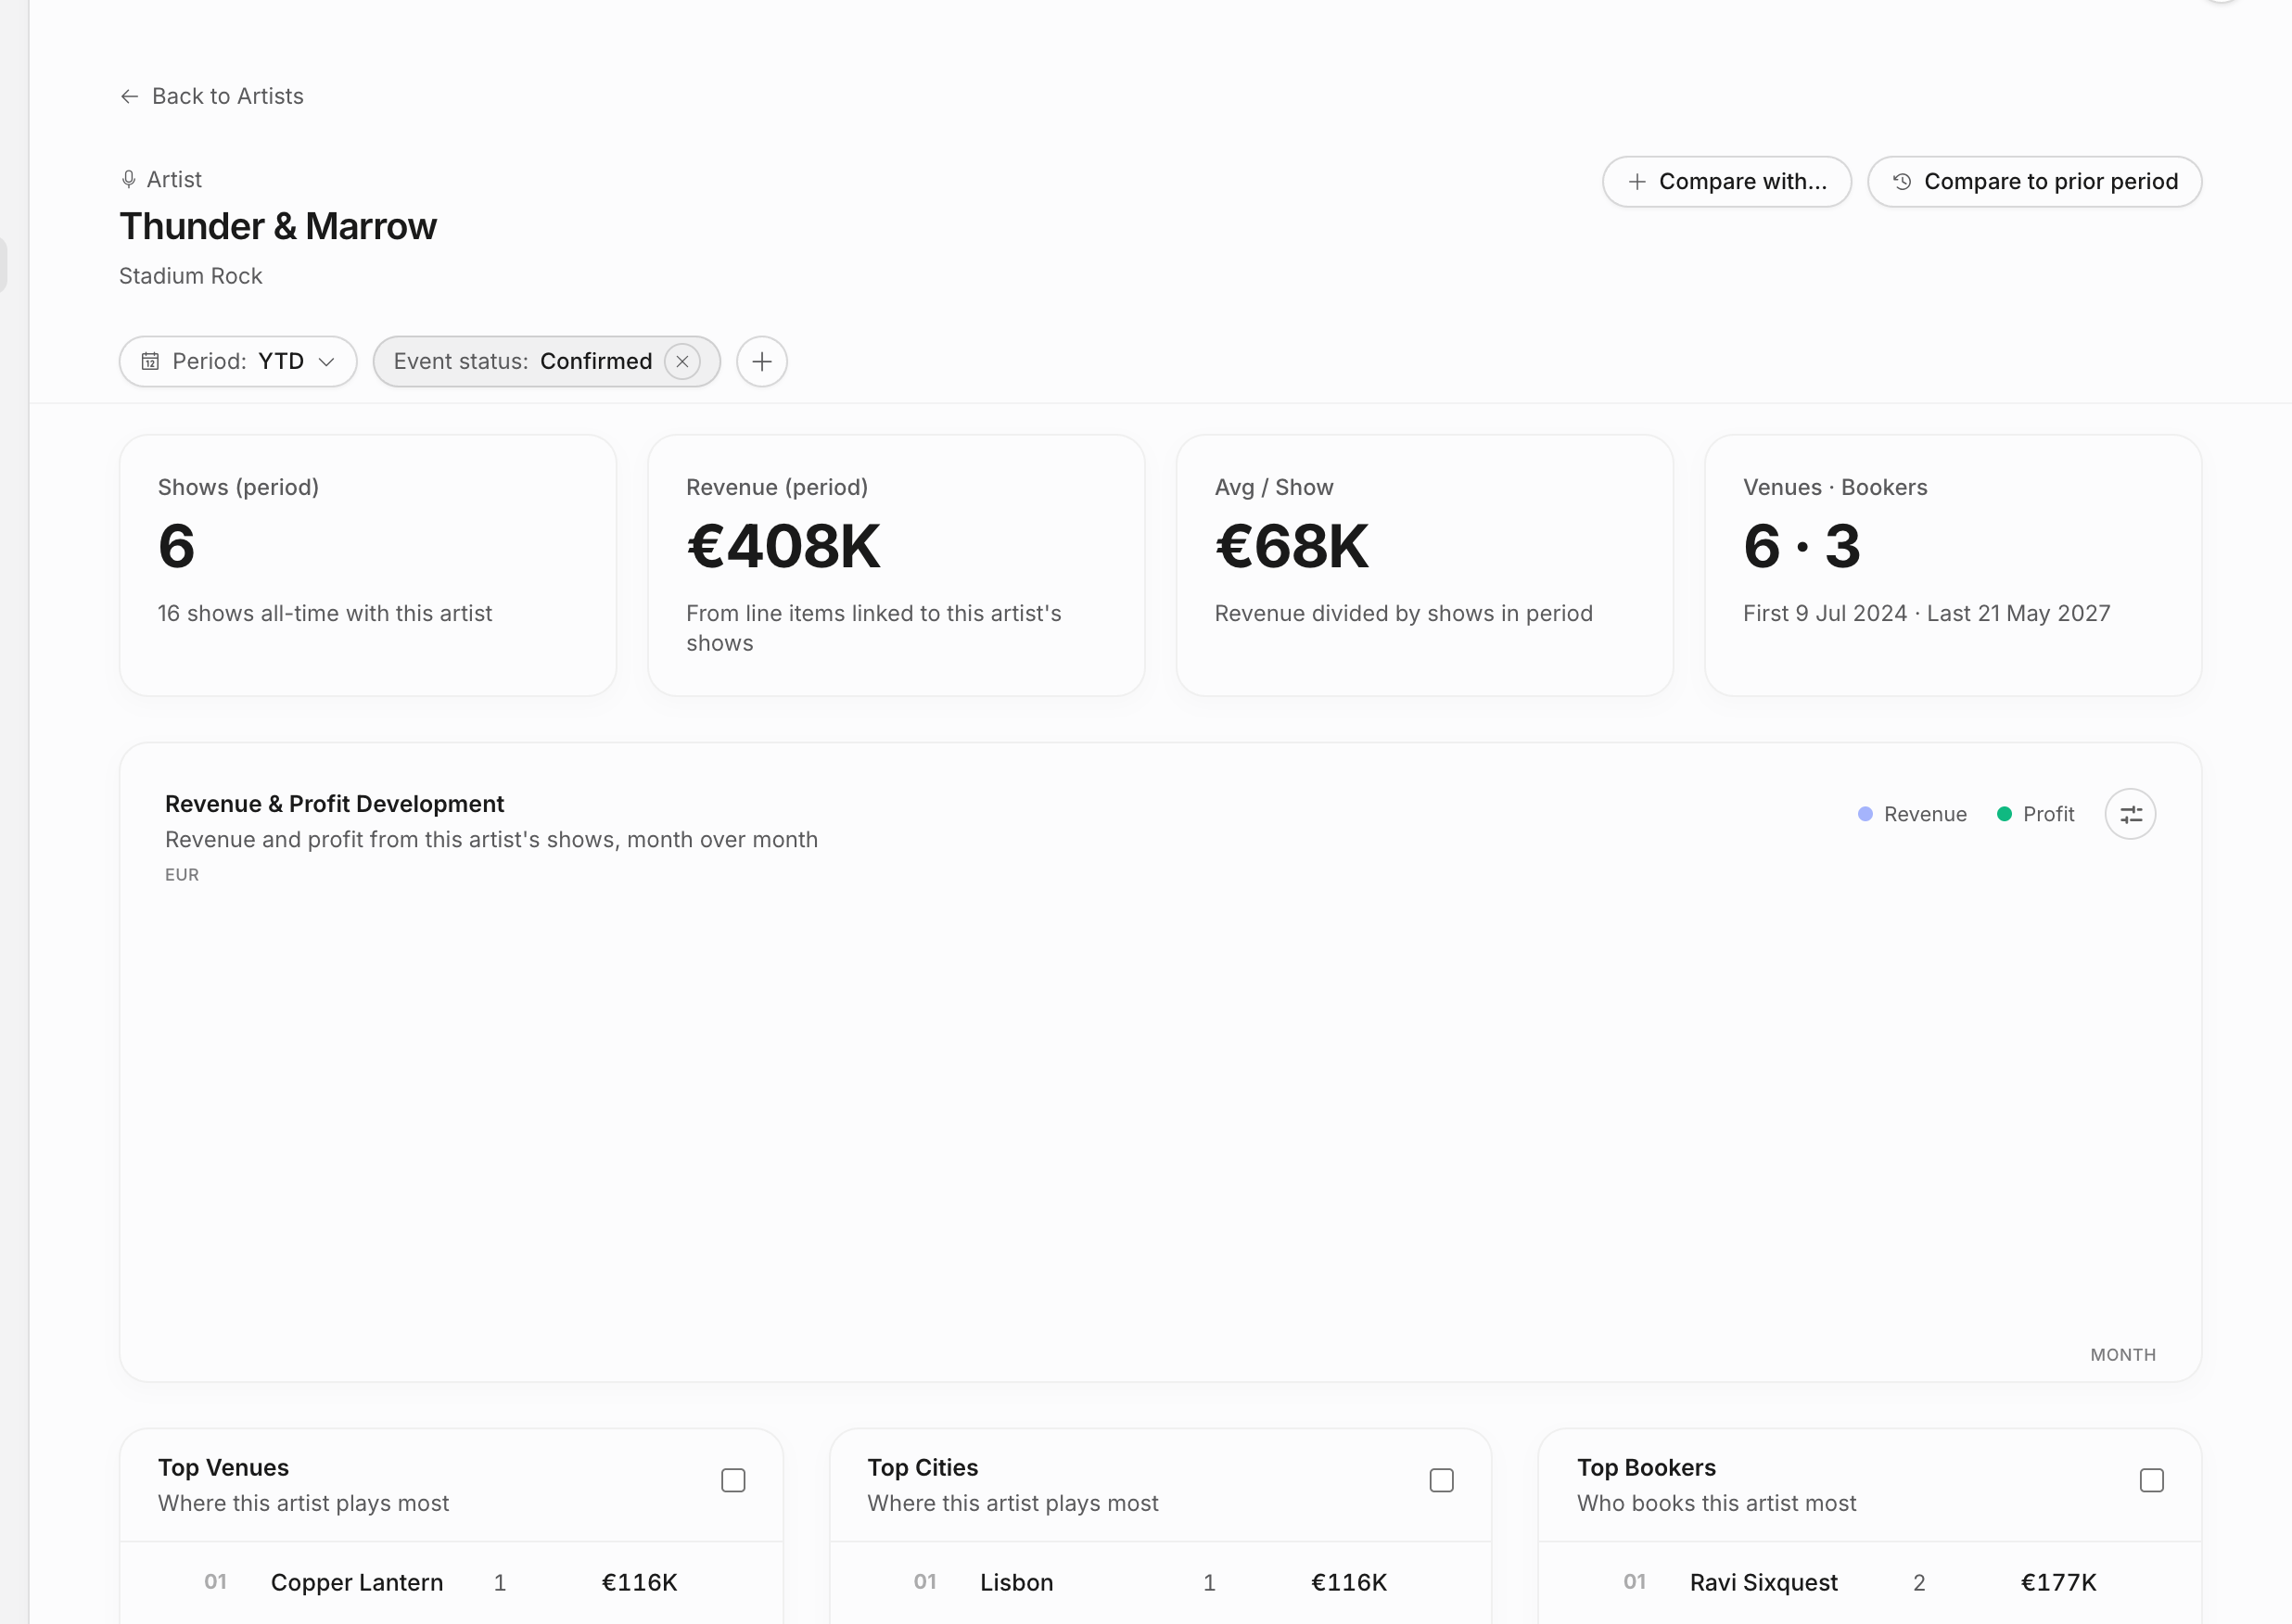
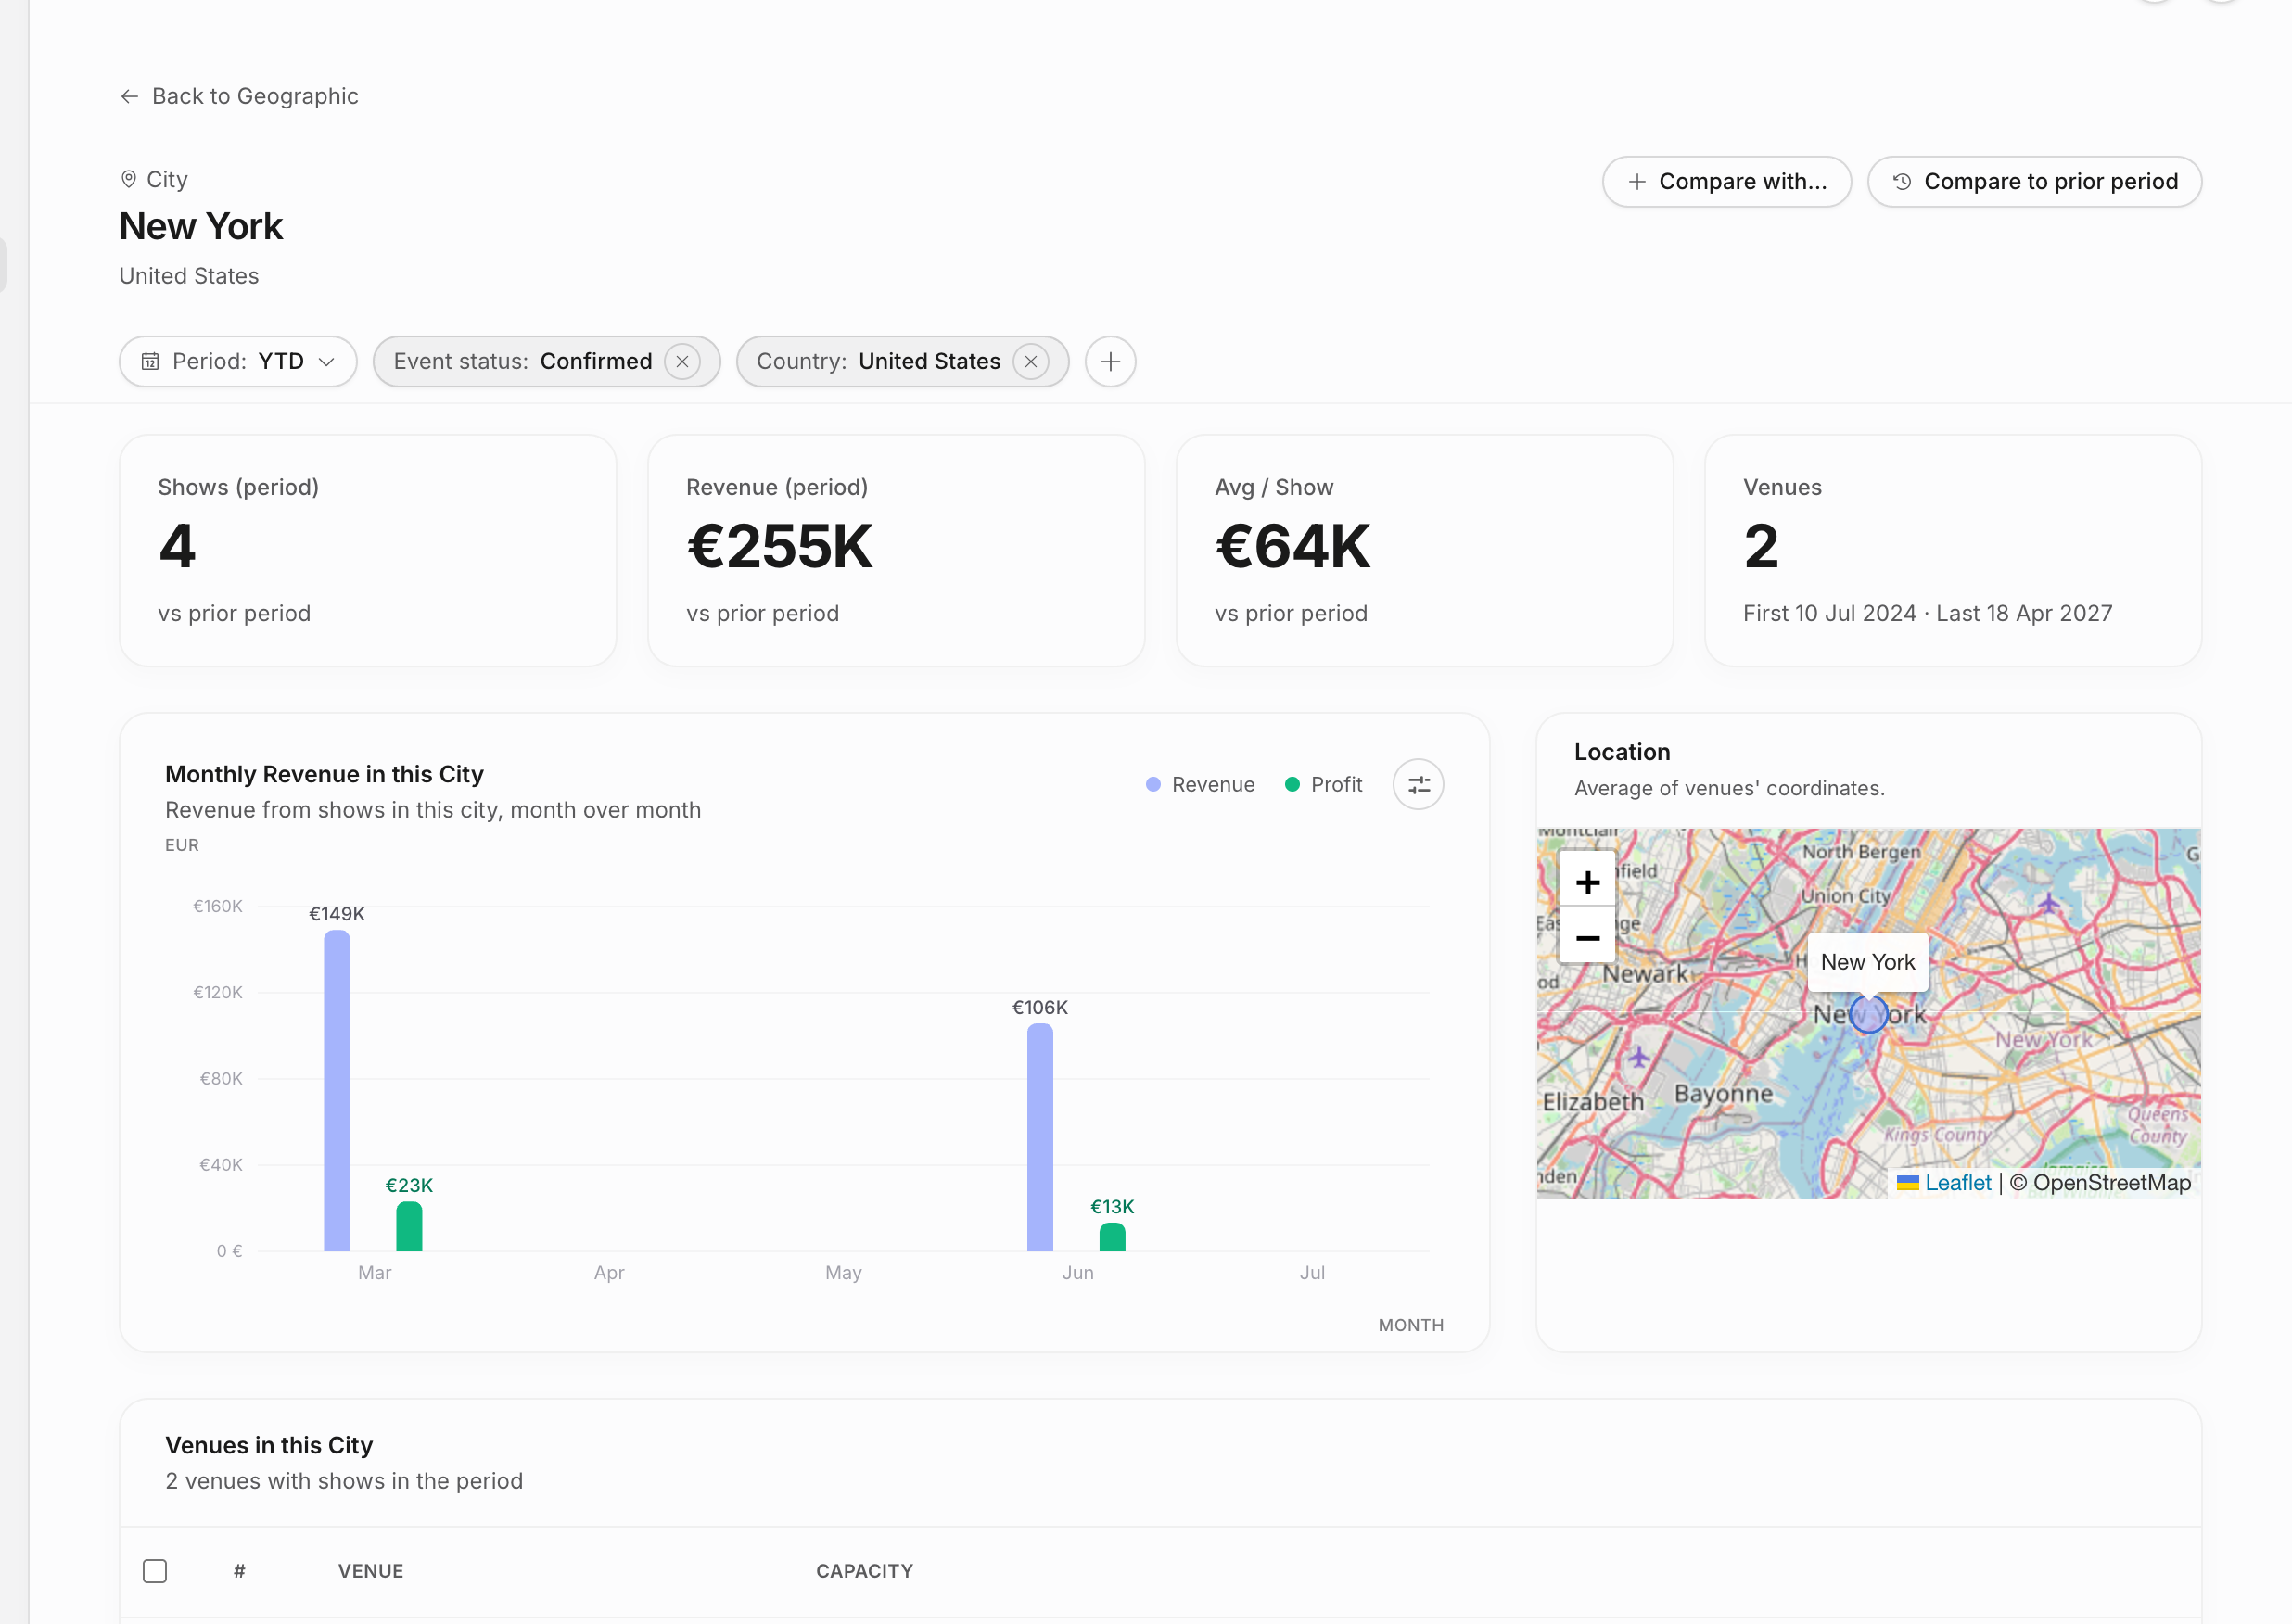
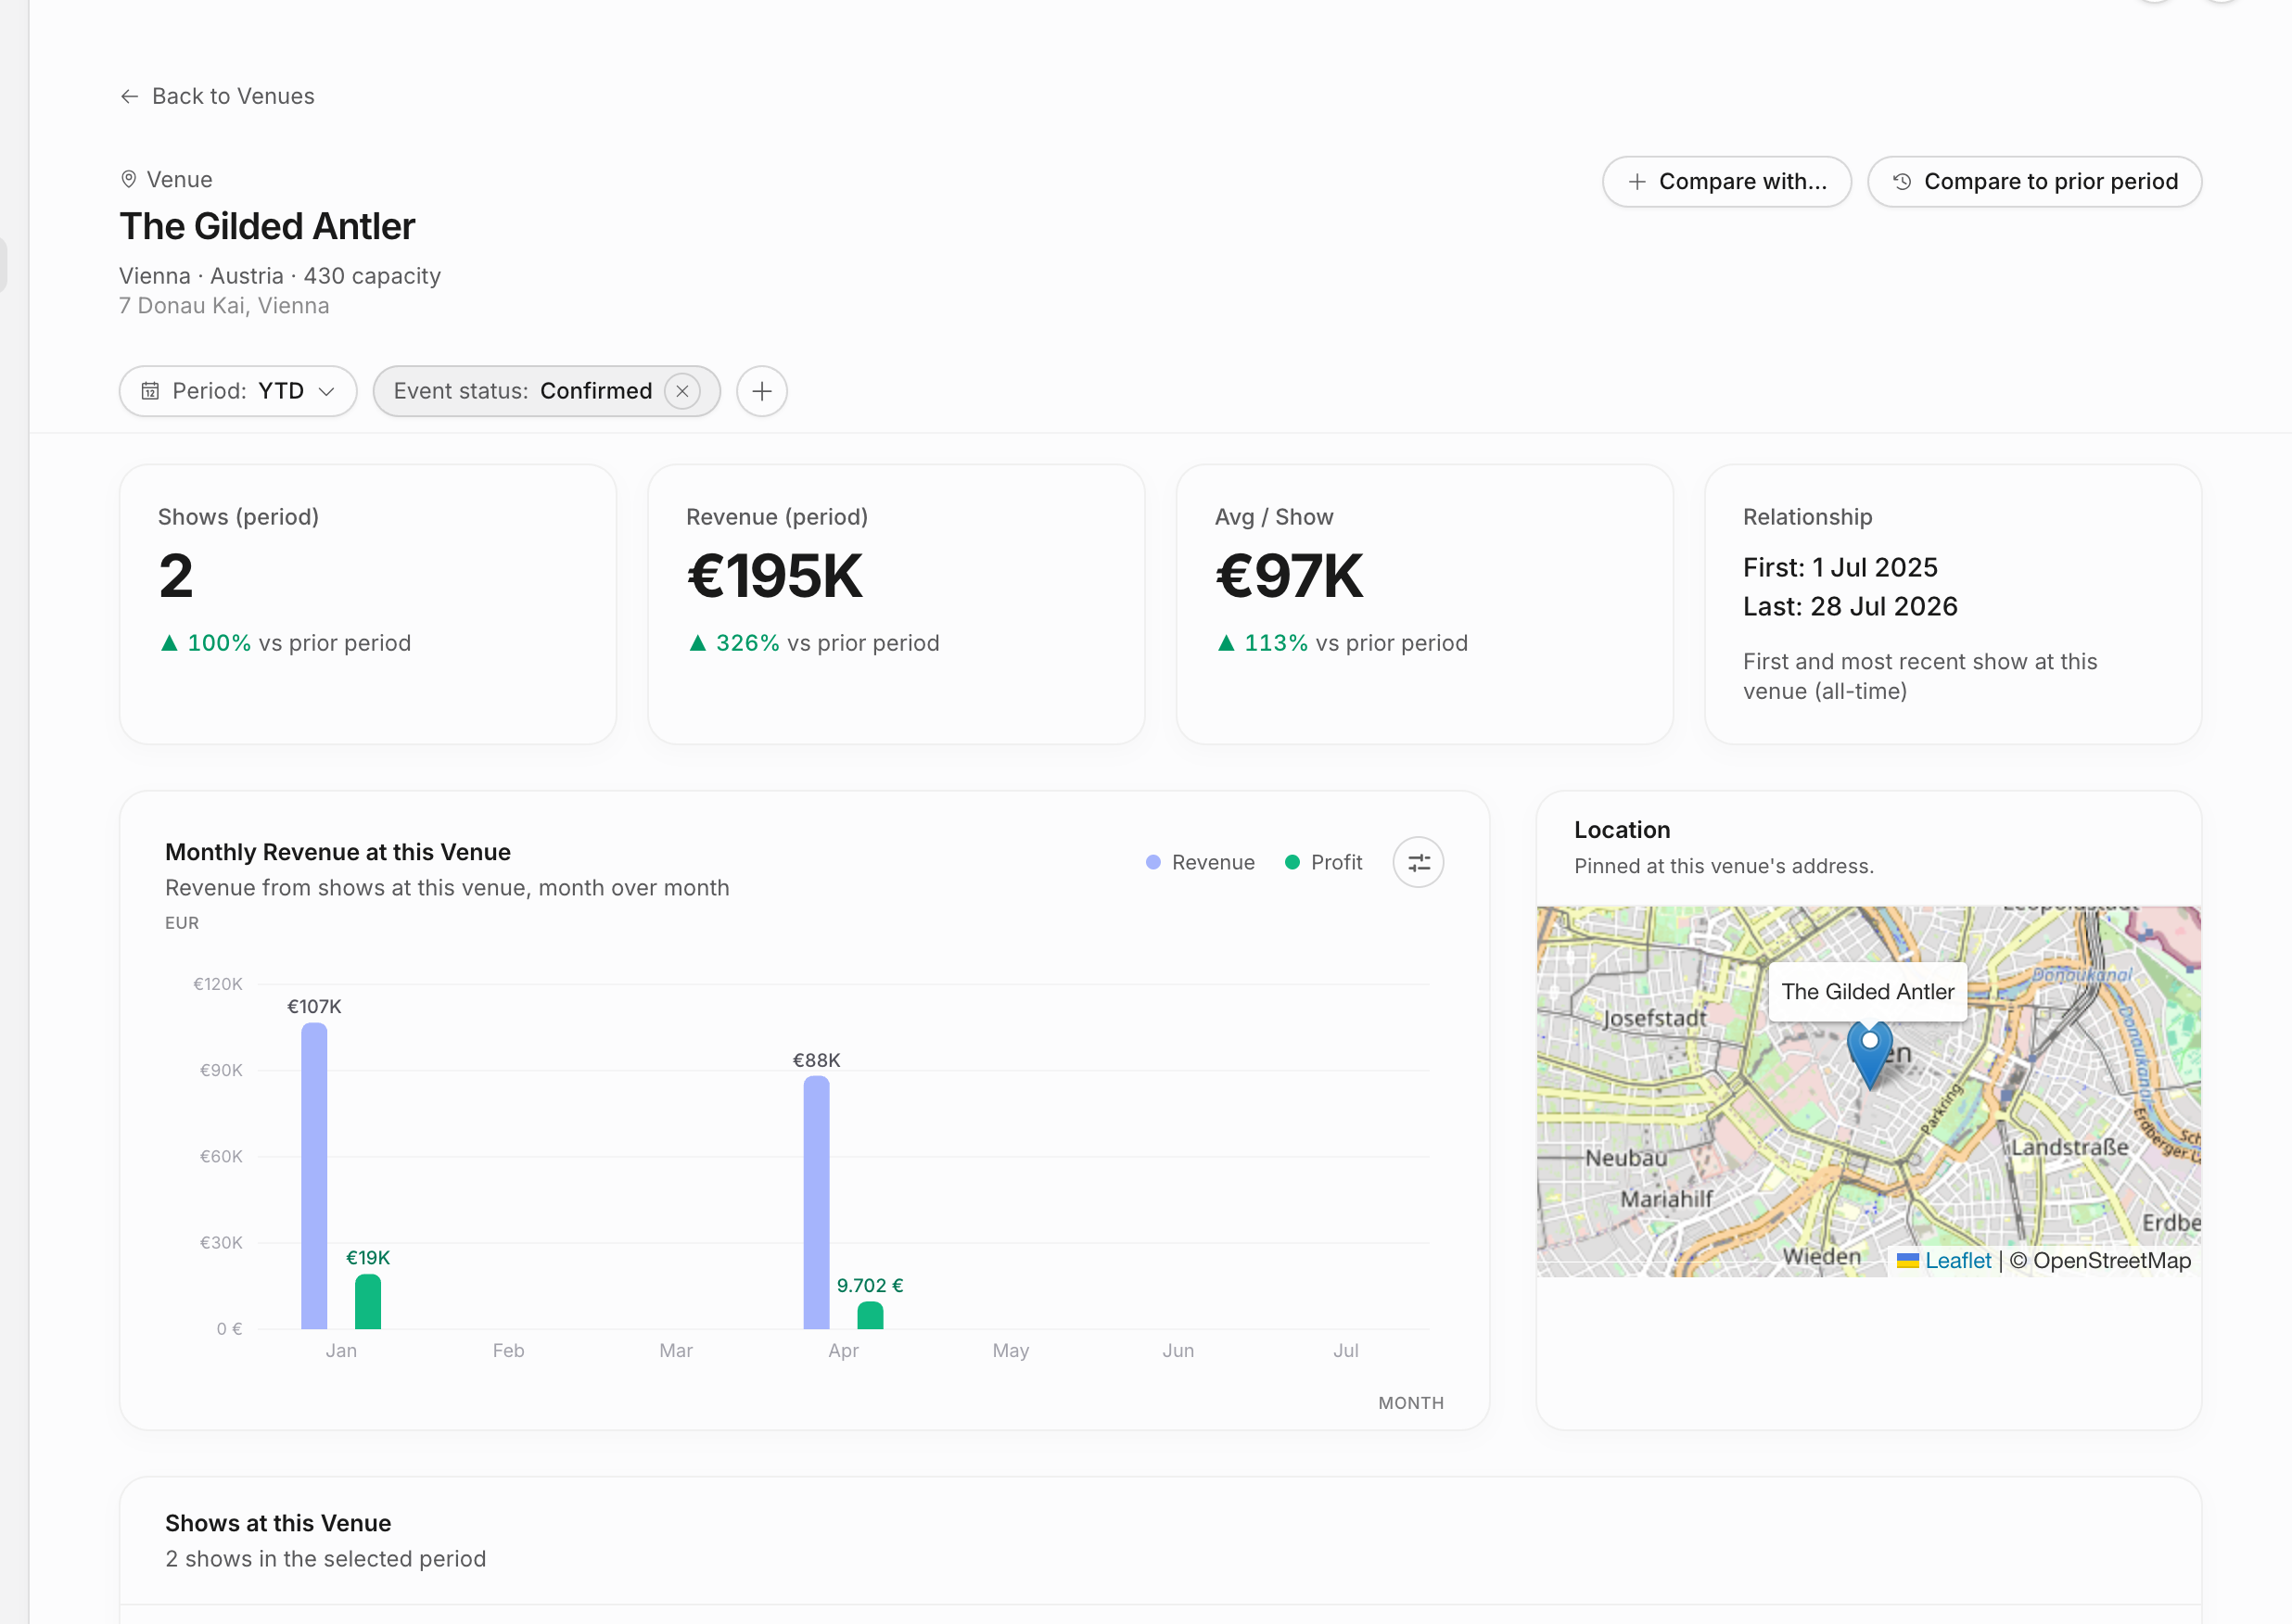
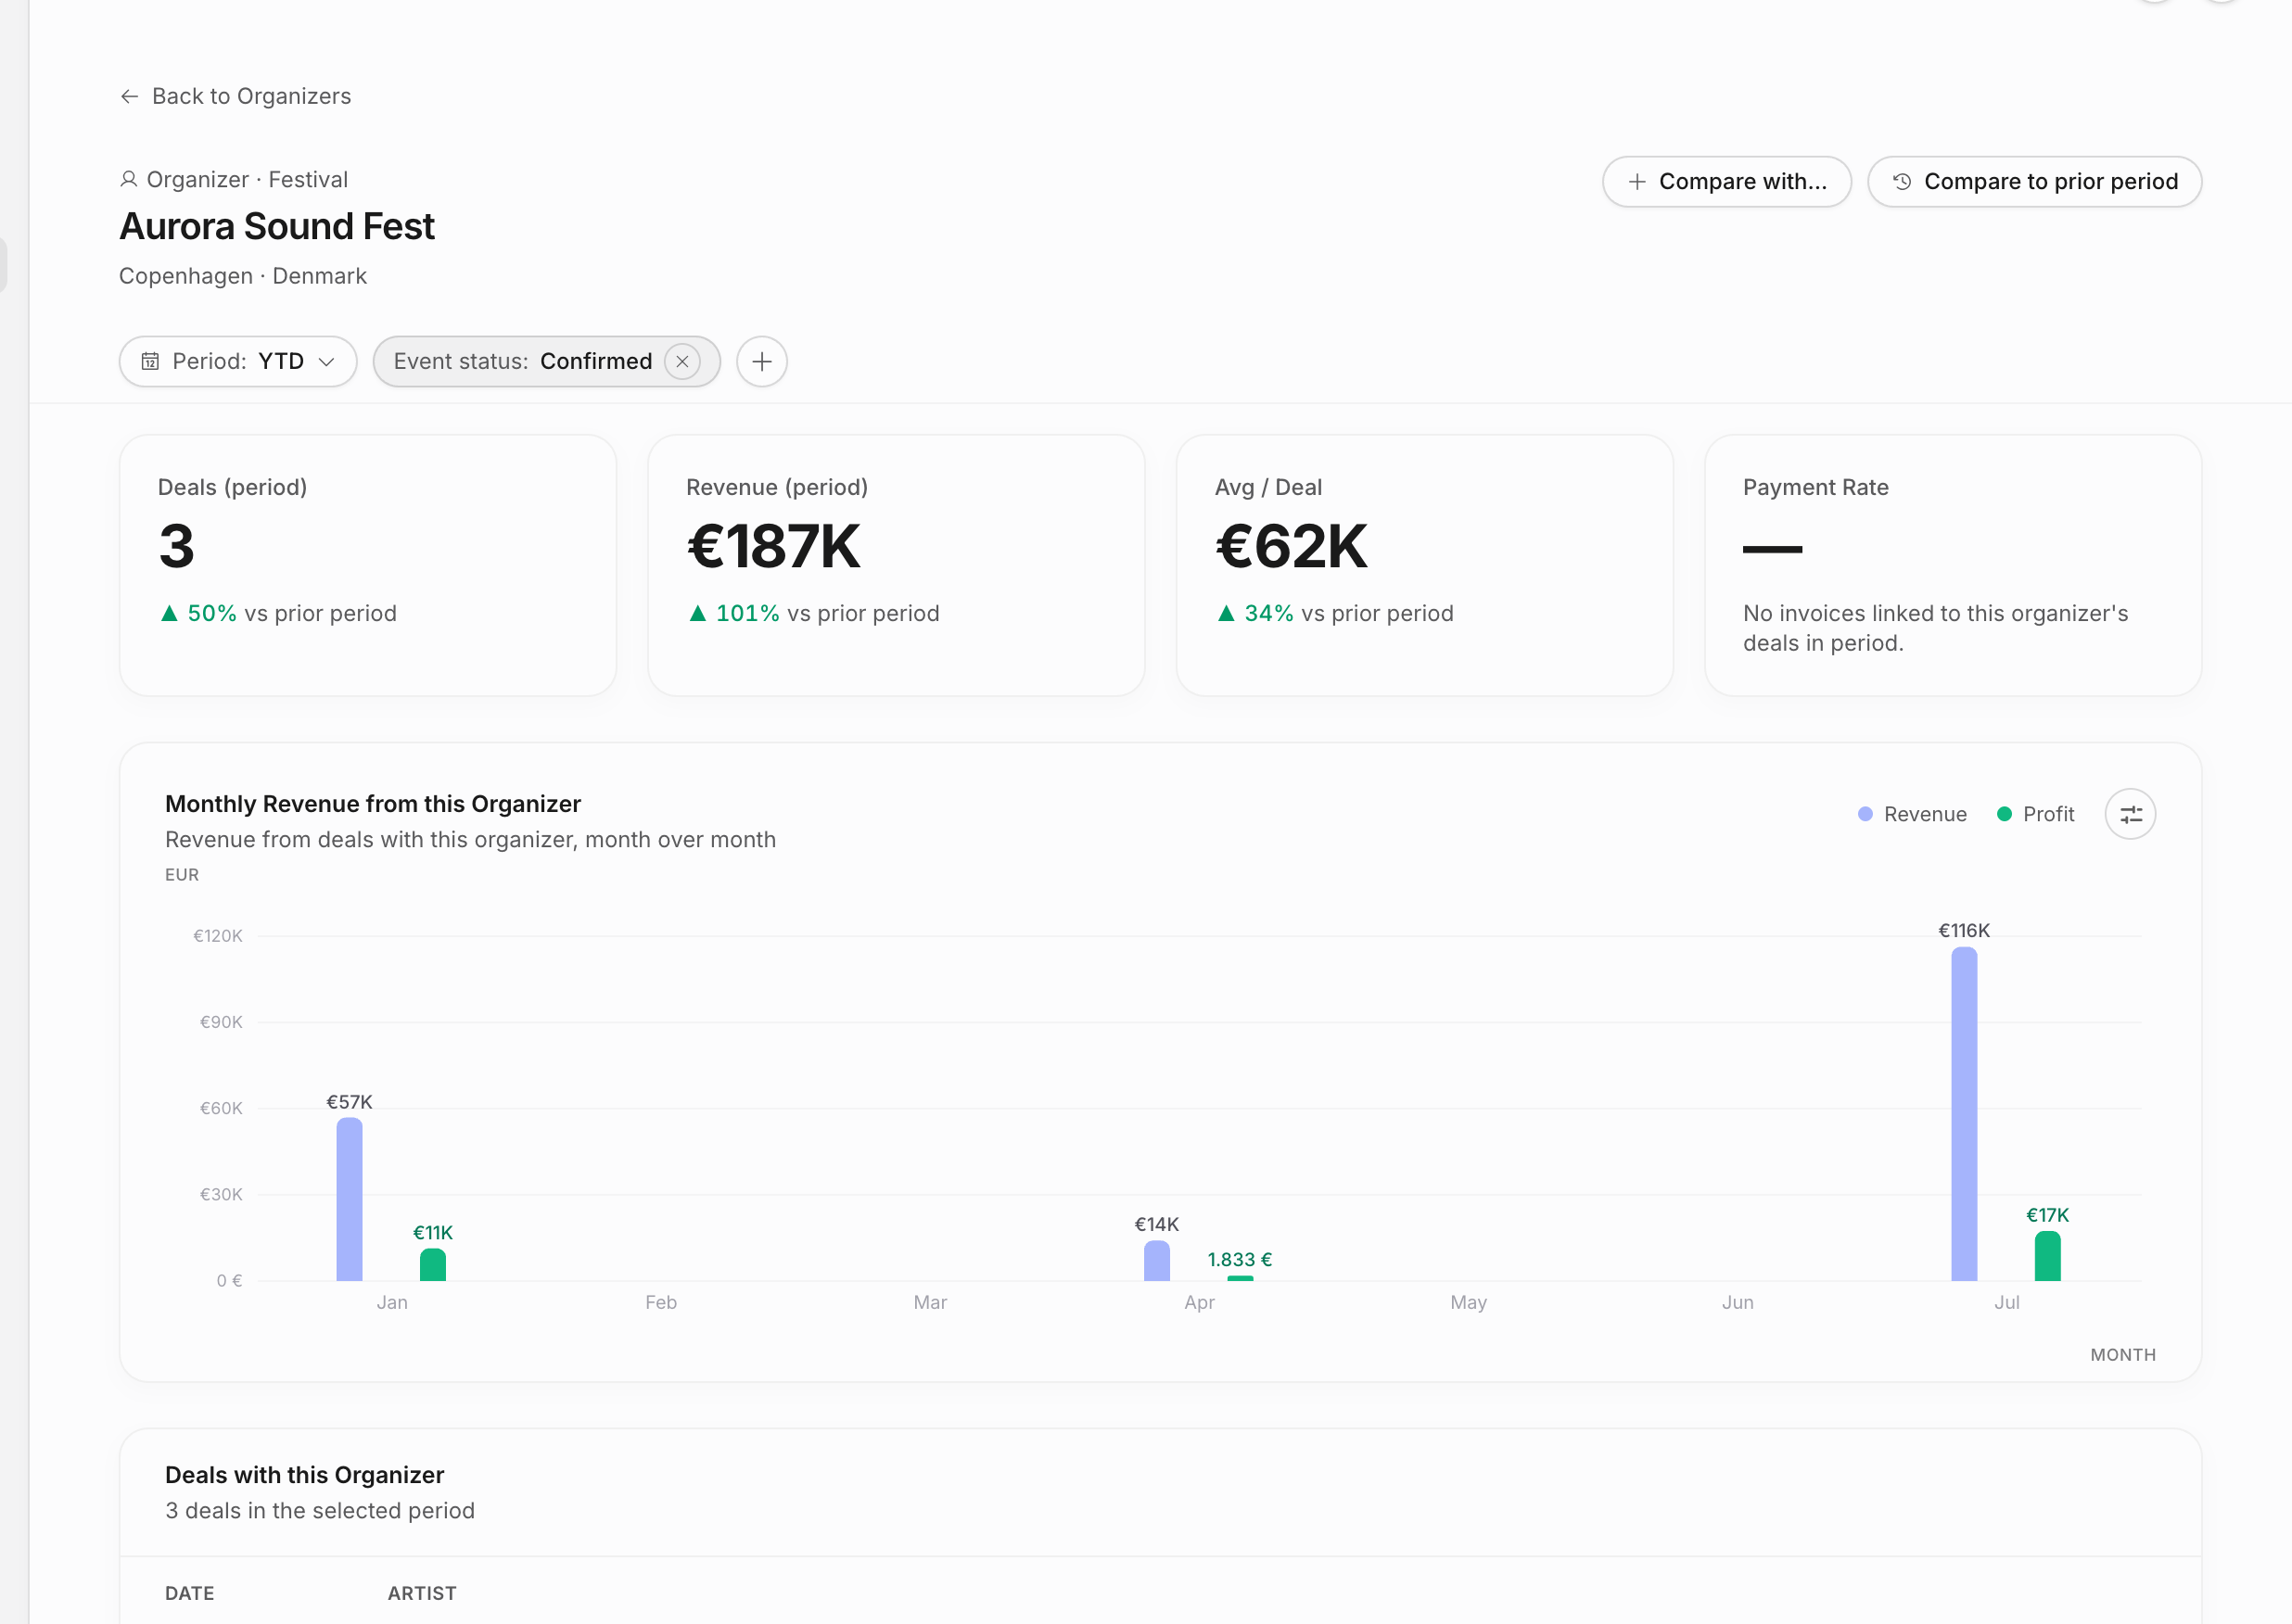
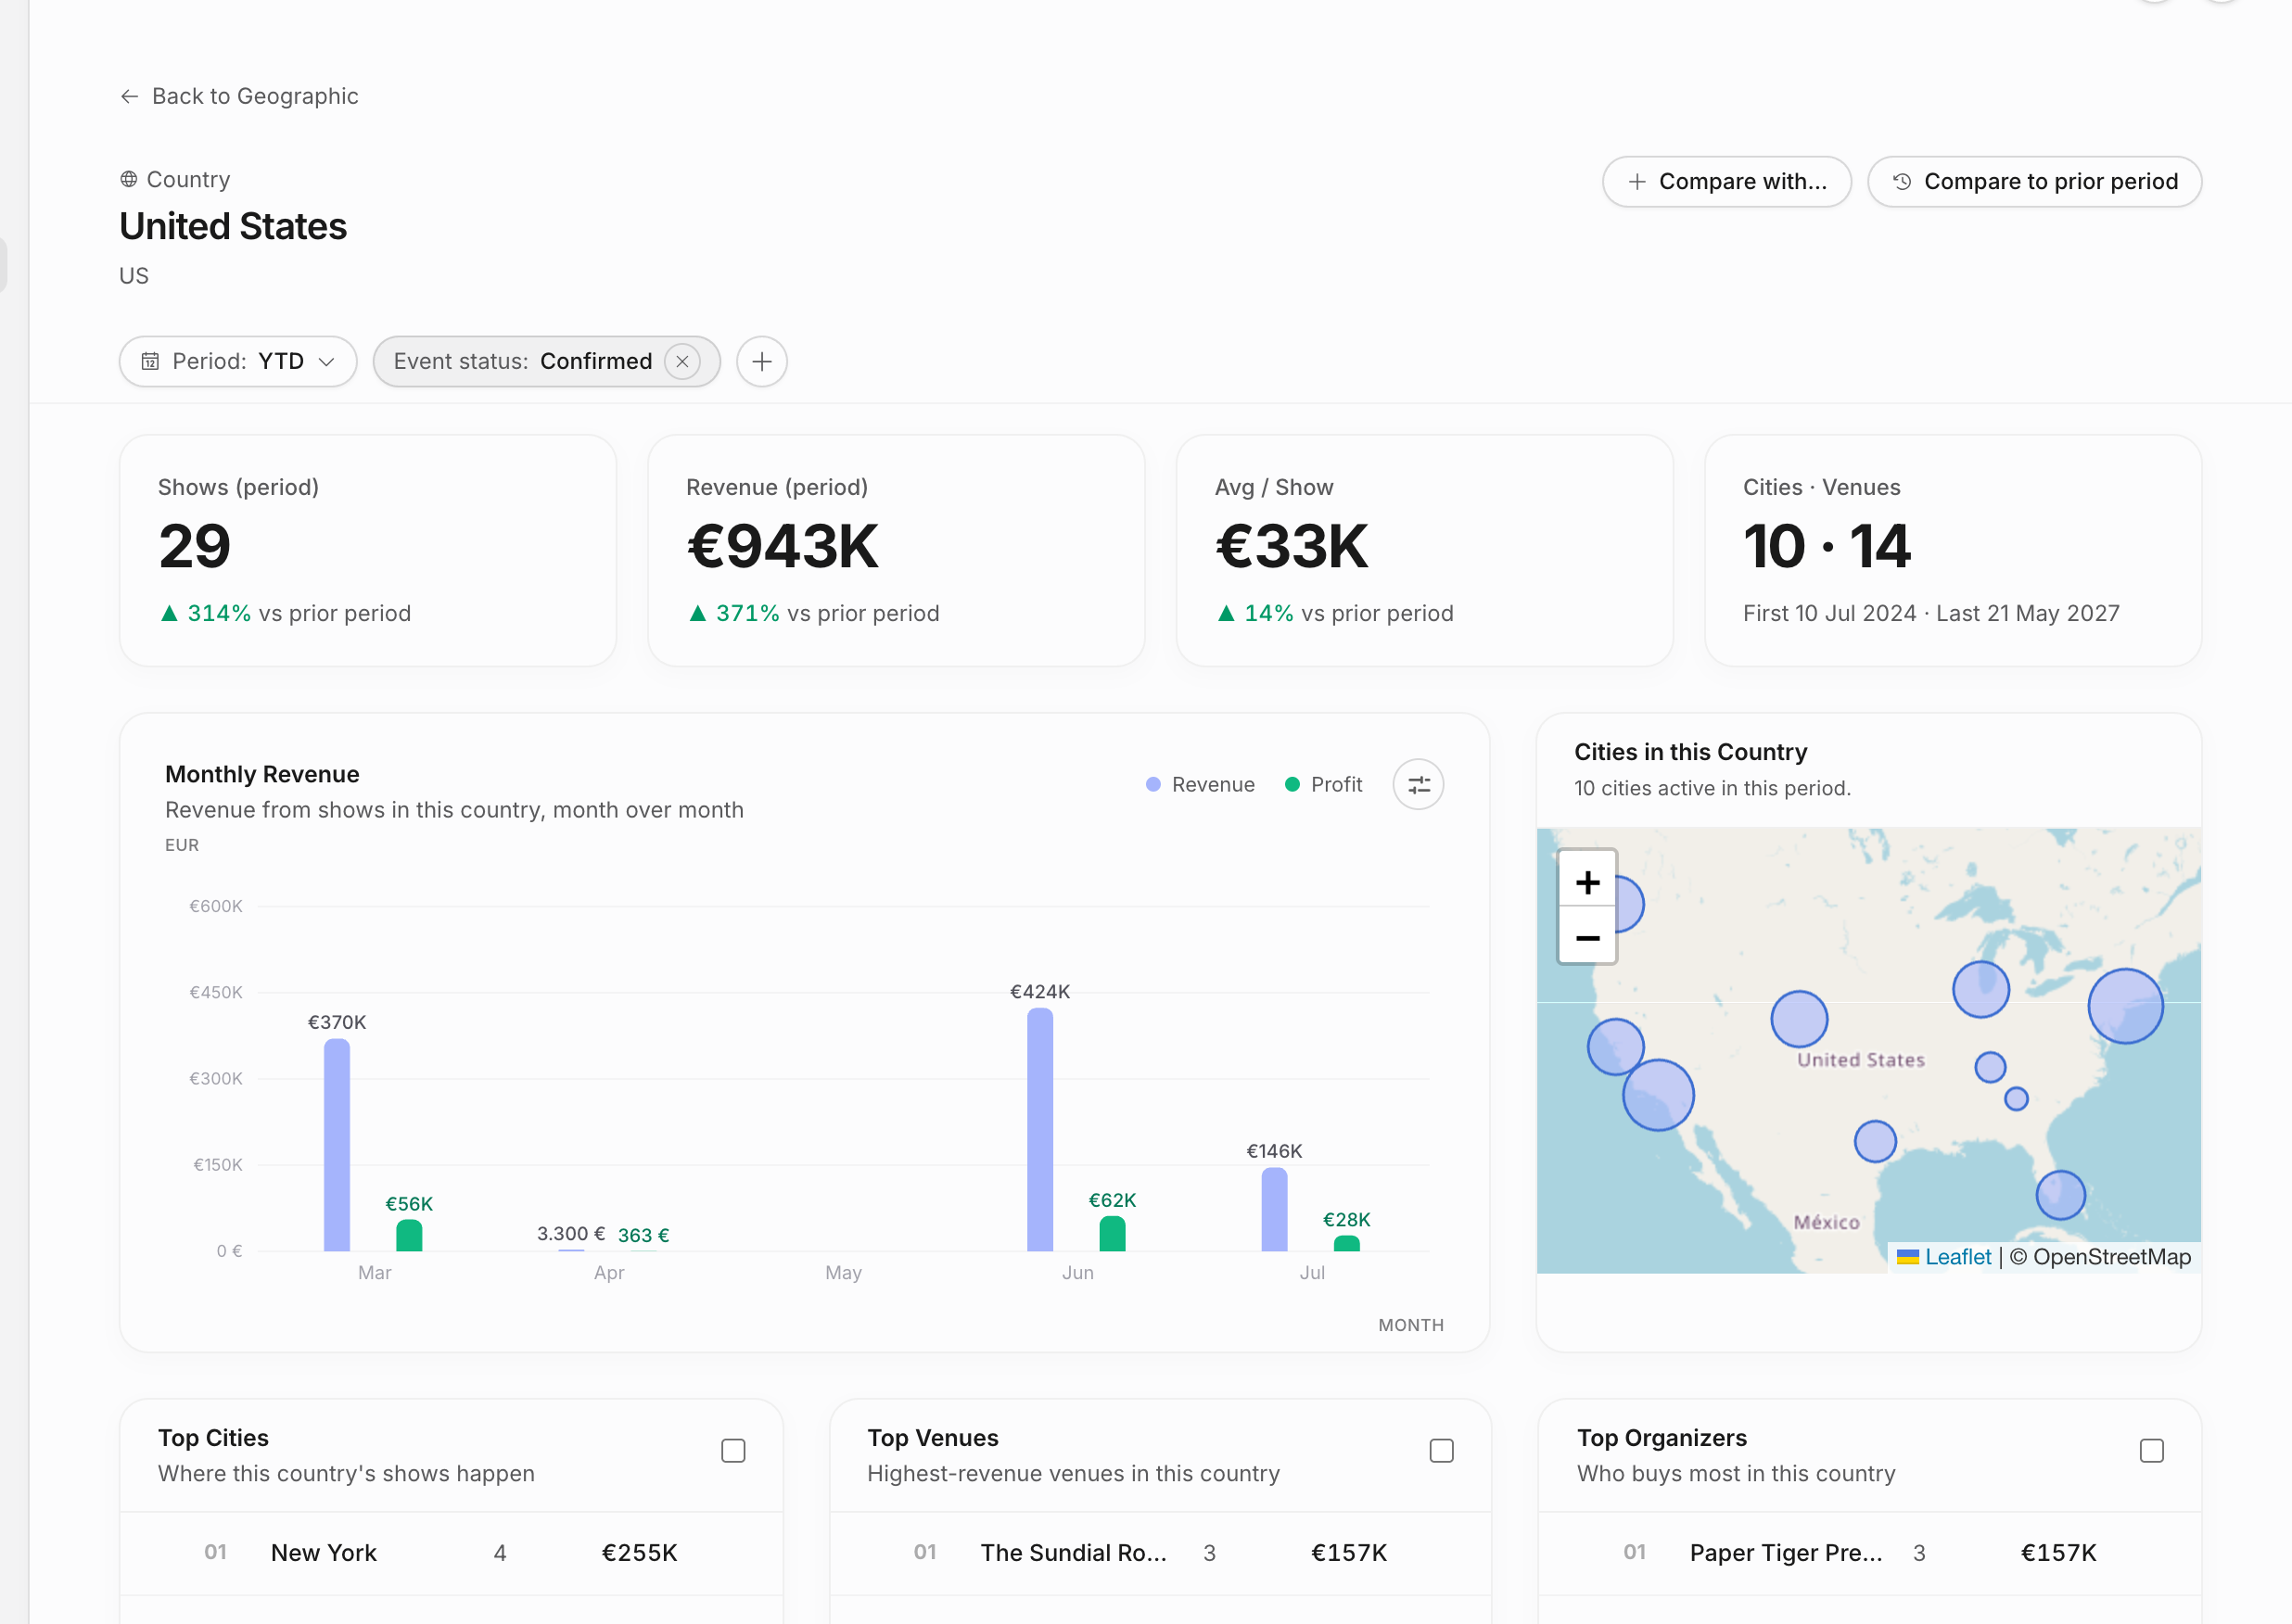
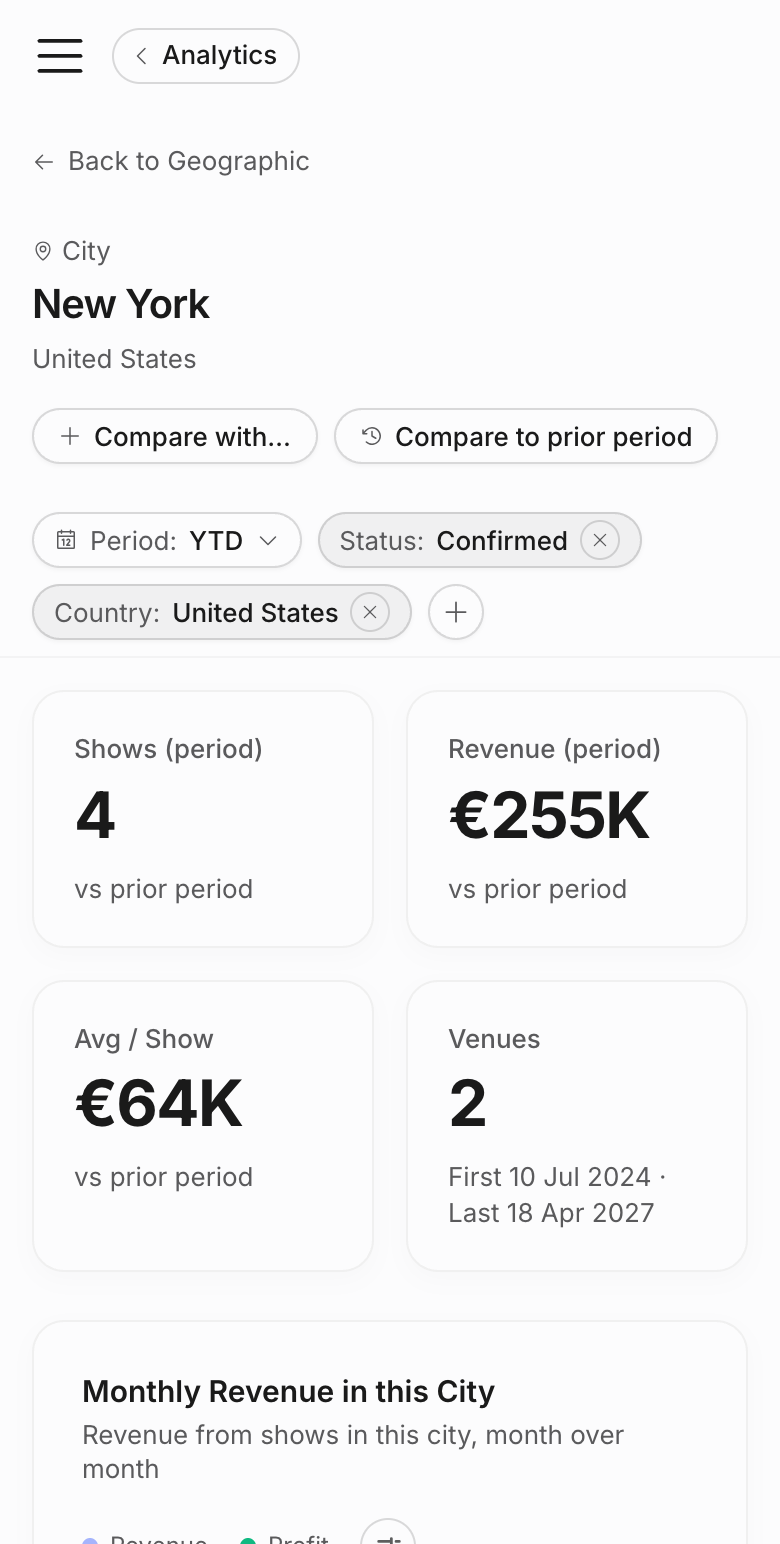
Each detail page can lead to two comparison paths: compare that entity with similar entities, or compare that entity against its prior-year period.
The monthly trend on detail pages can open the underlying shows for a month or year. Use that when a chart spike needs investigation: it gives you the actual show list with revenue, profit, and margin instead of leaving the chart as a dead end.
Some tables also support preview and row actions. Shift-click or the preview affordance opens a compact preview; the row menu can open the entity, copy a link, or start an entity comparison.
Compare with prior year
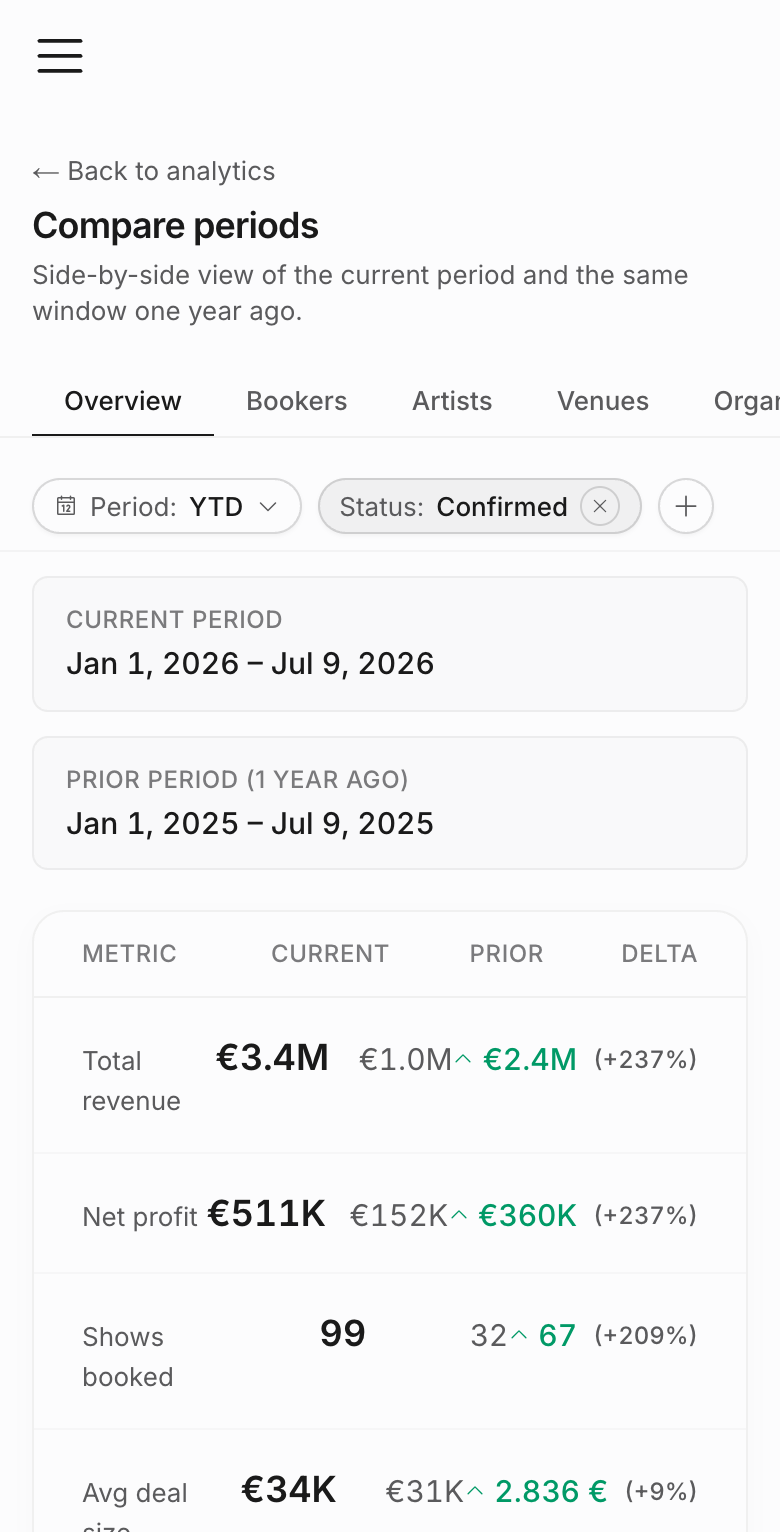
Use Compare with prior year when the question is about change over time. The page compares the selected date range with the matching prior-year window.
There are two modes:
| Mode | How it behaves |
|---|---|
| Agency-wide | Opens from the Analytics overview or a tab and compares the whole filtered analytics set. |
| Entity-scoped | Opens from an artist, booker, venue, organizer, city, or country detail page and compares only that entity. |
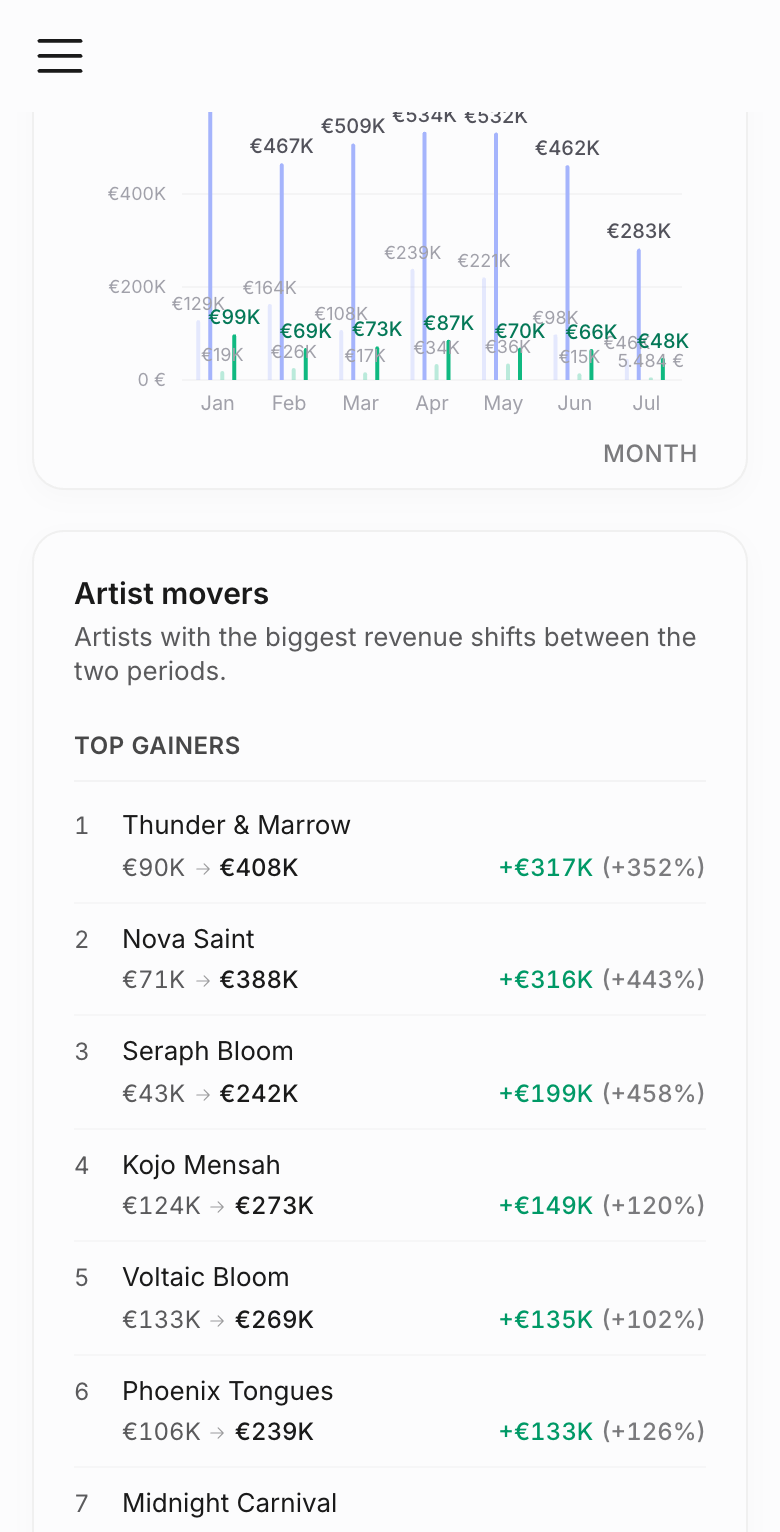
The agency-wide version keeps the Analytics tabs. Overview shows mover sections for artists, bookers, venues, organizers, and cities; a specific tab narrows the movers to that kind. The entity-scoped version focuses on the selected entity and does not show the full tab set.
If the selected period is All time, there is no matching prior window. In that case the compare page explains that a prior-year comparison cannot be calculated for all-time data.
Prior-year comparison is most useful for bounded periods such as this month, this quarter, YTD, last 12 months, last year, or a custom range. The trend chart uses ghost bars for prior-year values so current revenue and profit can be read beside the same months from the previous year.
Compare entities
Use entity comparison when the question is about relative performance in the same period, such as two venues, several artists, or a group of bookers.
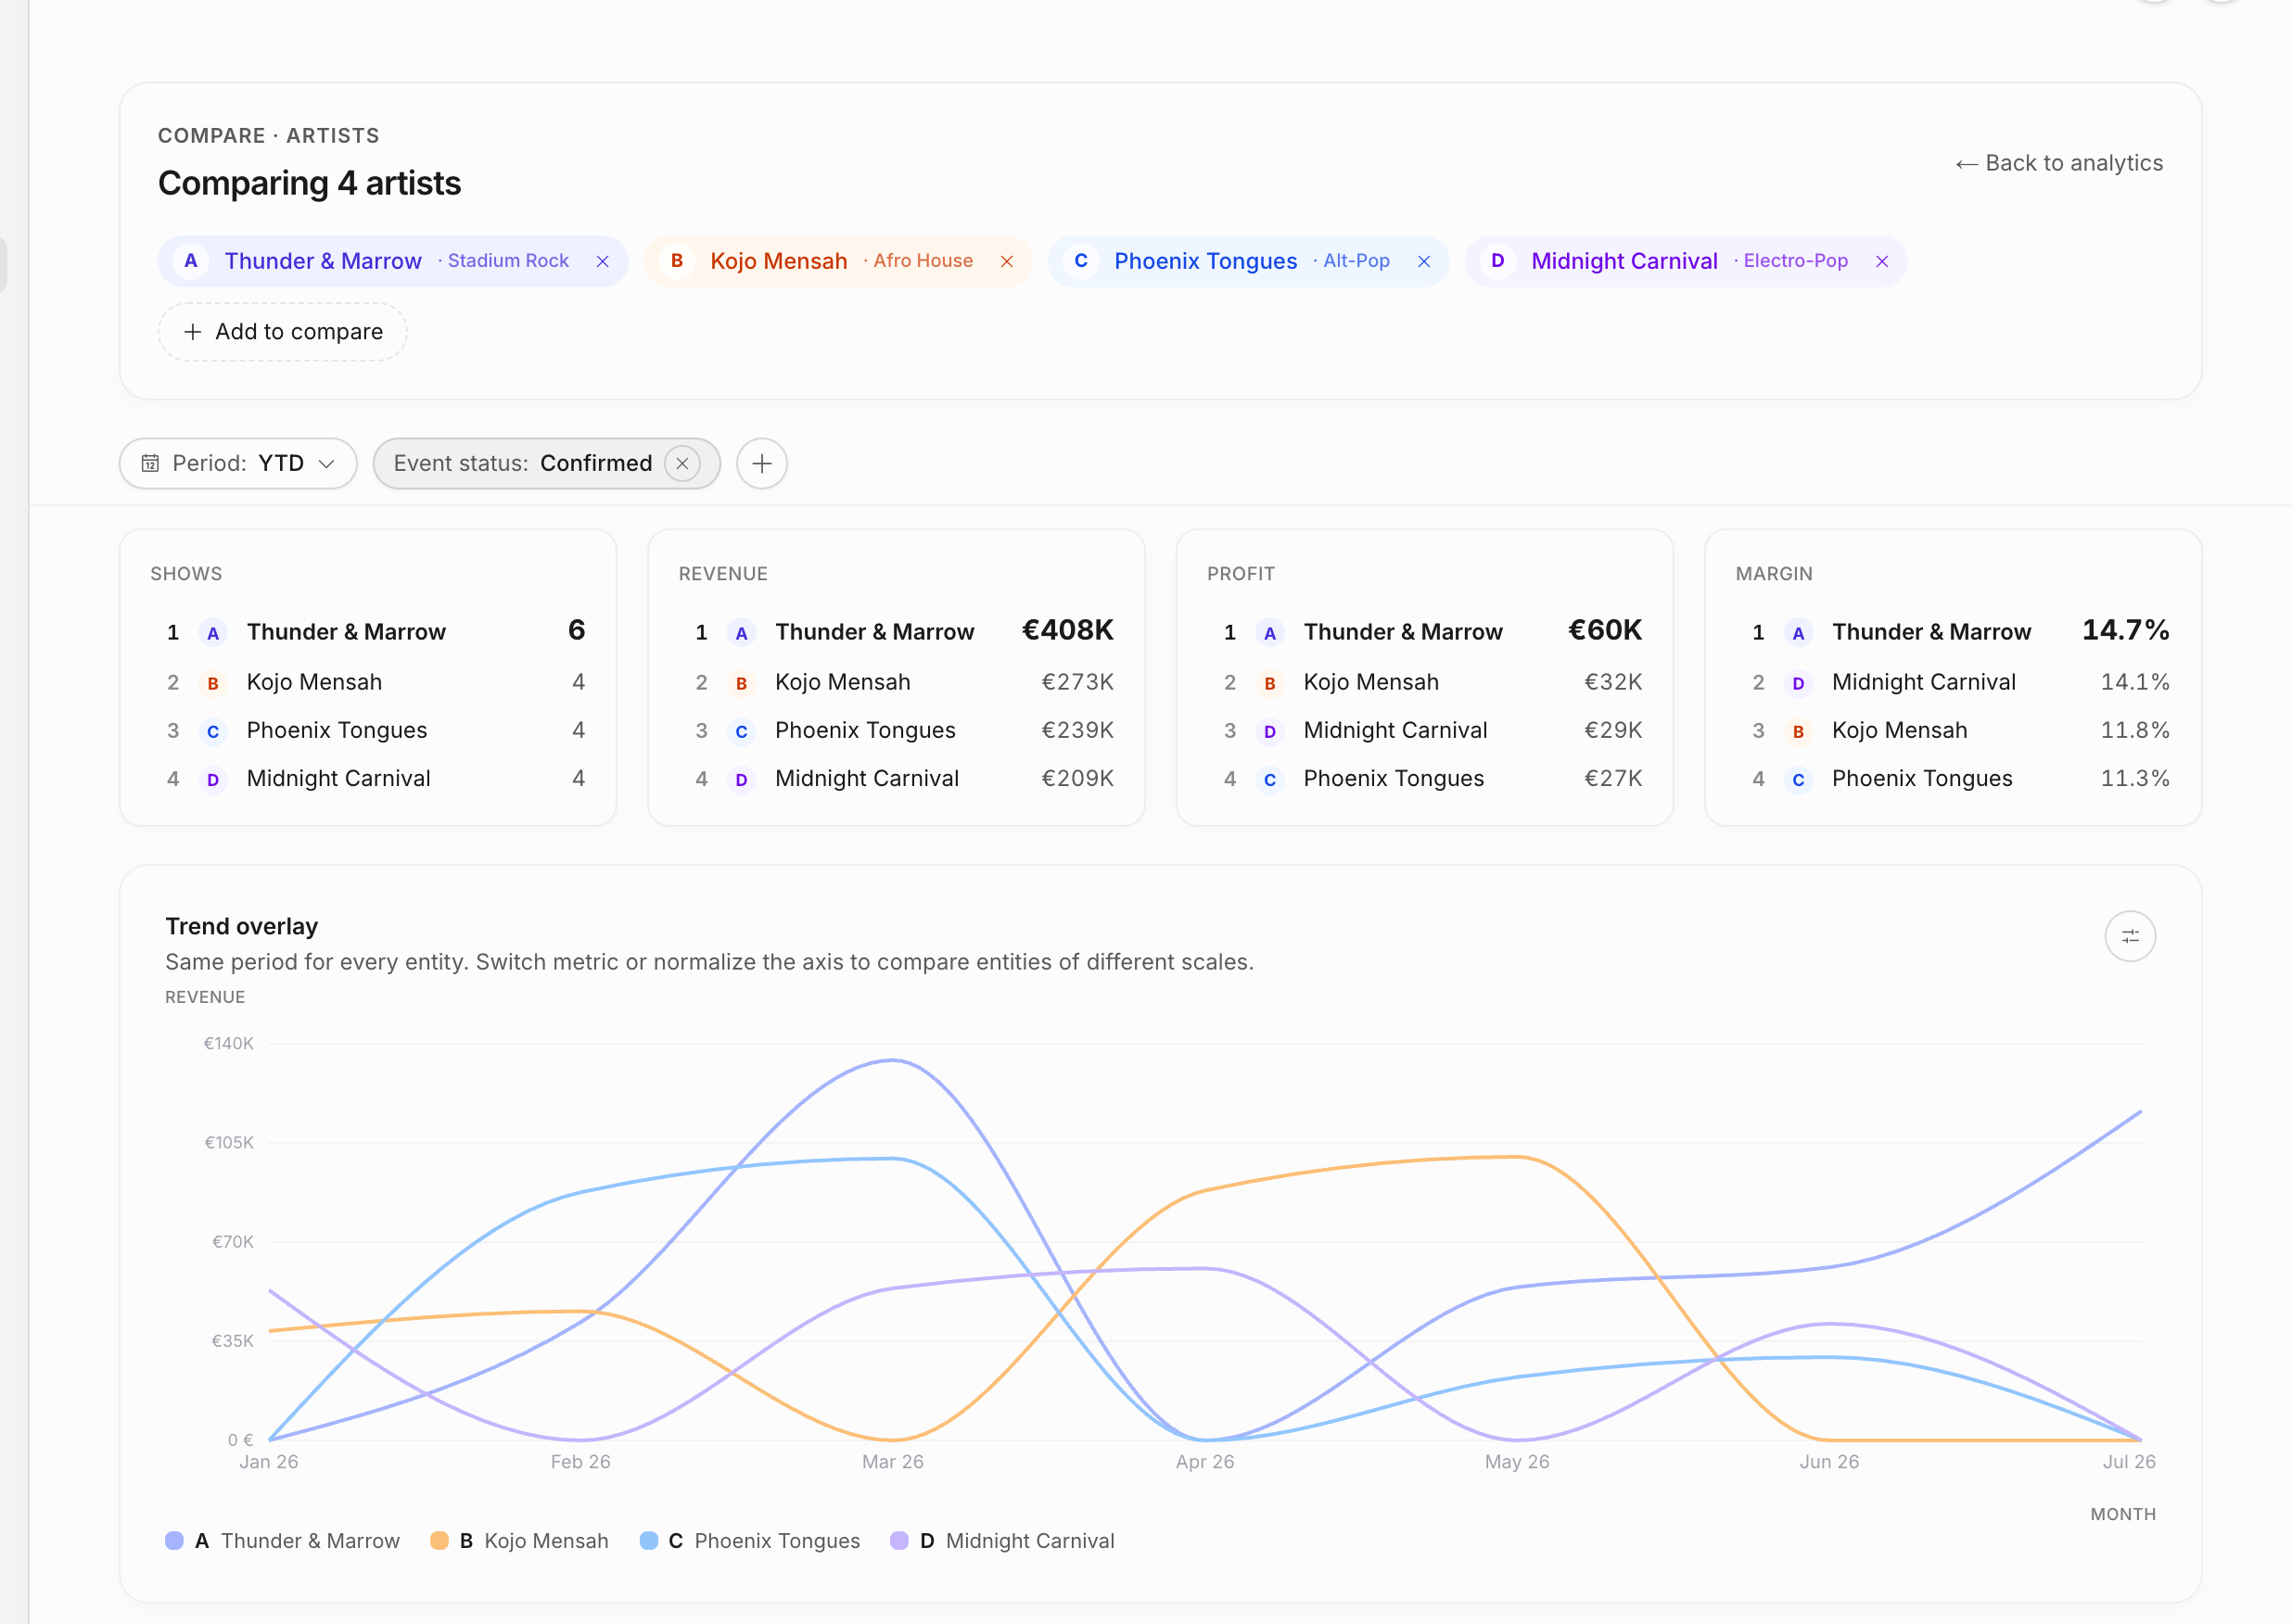
The compare page supports two to six entities of the same type:
| Selection | Result |
|---|---|
| Two entities | Side-by-side KPI strip, shared trend, and top lists. |
| Three to six entities | Leader cards, shared trend, top lists, and small multiples. |
| One or zero entities | Empty state that sends you back to choose more entities. |
| More than six entities | Empty state explaining the selection limit. |
You may also see an empty or reduced comparison if a selected entity was deleted, filtered out, or outside your analytics scope.
Entity comparison uses the same period and filters as the page you came from. It supports artists, bookers, venues, organizers, cities, and countries. The shared KPI model is shows, revenue, profit, margin, and average deal size.
Top-list depth depends on the entity type:
| Compared entity | Secondary lists currently available |
|---|---|
| Artist | Top venues, top cities, and top bookers. |
| Booker | Top artists, top venues, and top organizers. |
| Venue | KPI and trend comparison; top-list data is not populated yet. |
| Organizer | KPI and trend comparison; top-list data is not populated yet. |
| City | Top venues. |
| Country | Top cities, top venues, and top organizers. |
For three to six entities, small multiples help you compare shape, not only total size. Use the normalization option in the trend chart when one entity is much larger than the others and you want to compare relative momentum.
Scopes still apply
Analytics access, artist scope, booker-scoped analytics, and financial-data permissions apply to drilldowns and compare pages too. A comparison should not reveal records or money the user cannot see elsewhere.
For example, a user with booker-scoped Analytics sees only analytics for events where they are the booker. A user without financial-data permission may see less commercial detail than someone with full financial access.
The same rule applies to comparison URLs. Sharing a compare link does not bypass permissions; another teammate only sees the entities and values their role, artist scope, booker scope, and financial permissions allow.
Data quality
Comparison pages are only as useful as the underlying records. Keep shows connected to the right artist, booker, venue, organizer, city, status, dates, revenue lines, cost lines, contracts, and invoices. Missing links can make a real business relationship look absent from Analytics.
Related: Explore analytics, Analytics access and scopes, Show fields.