
Explore analytics
Analytics turns show, artist, venue, organizer, booker, location, and financial data into business views you can scan and drill into.
Start with the overview
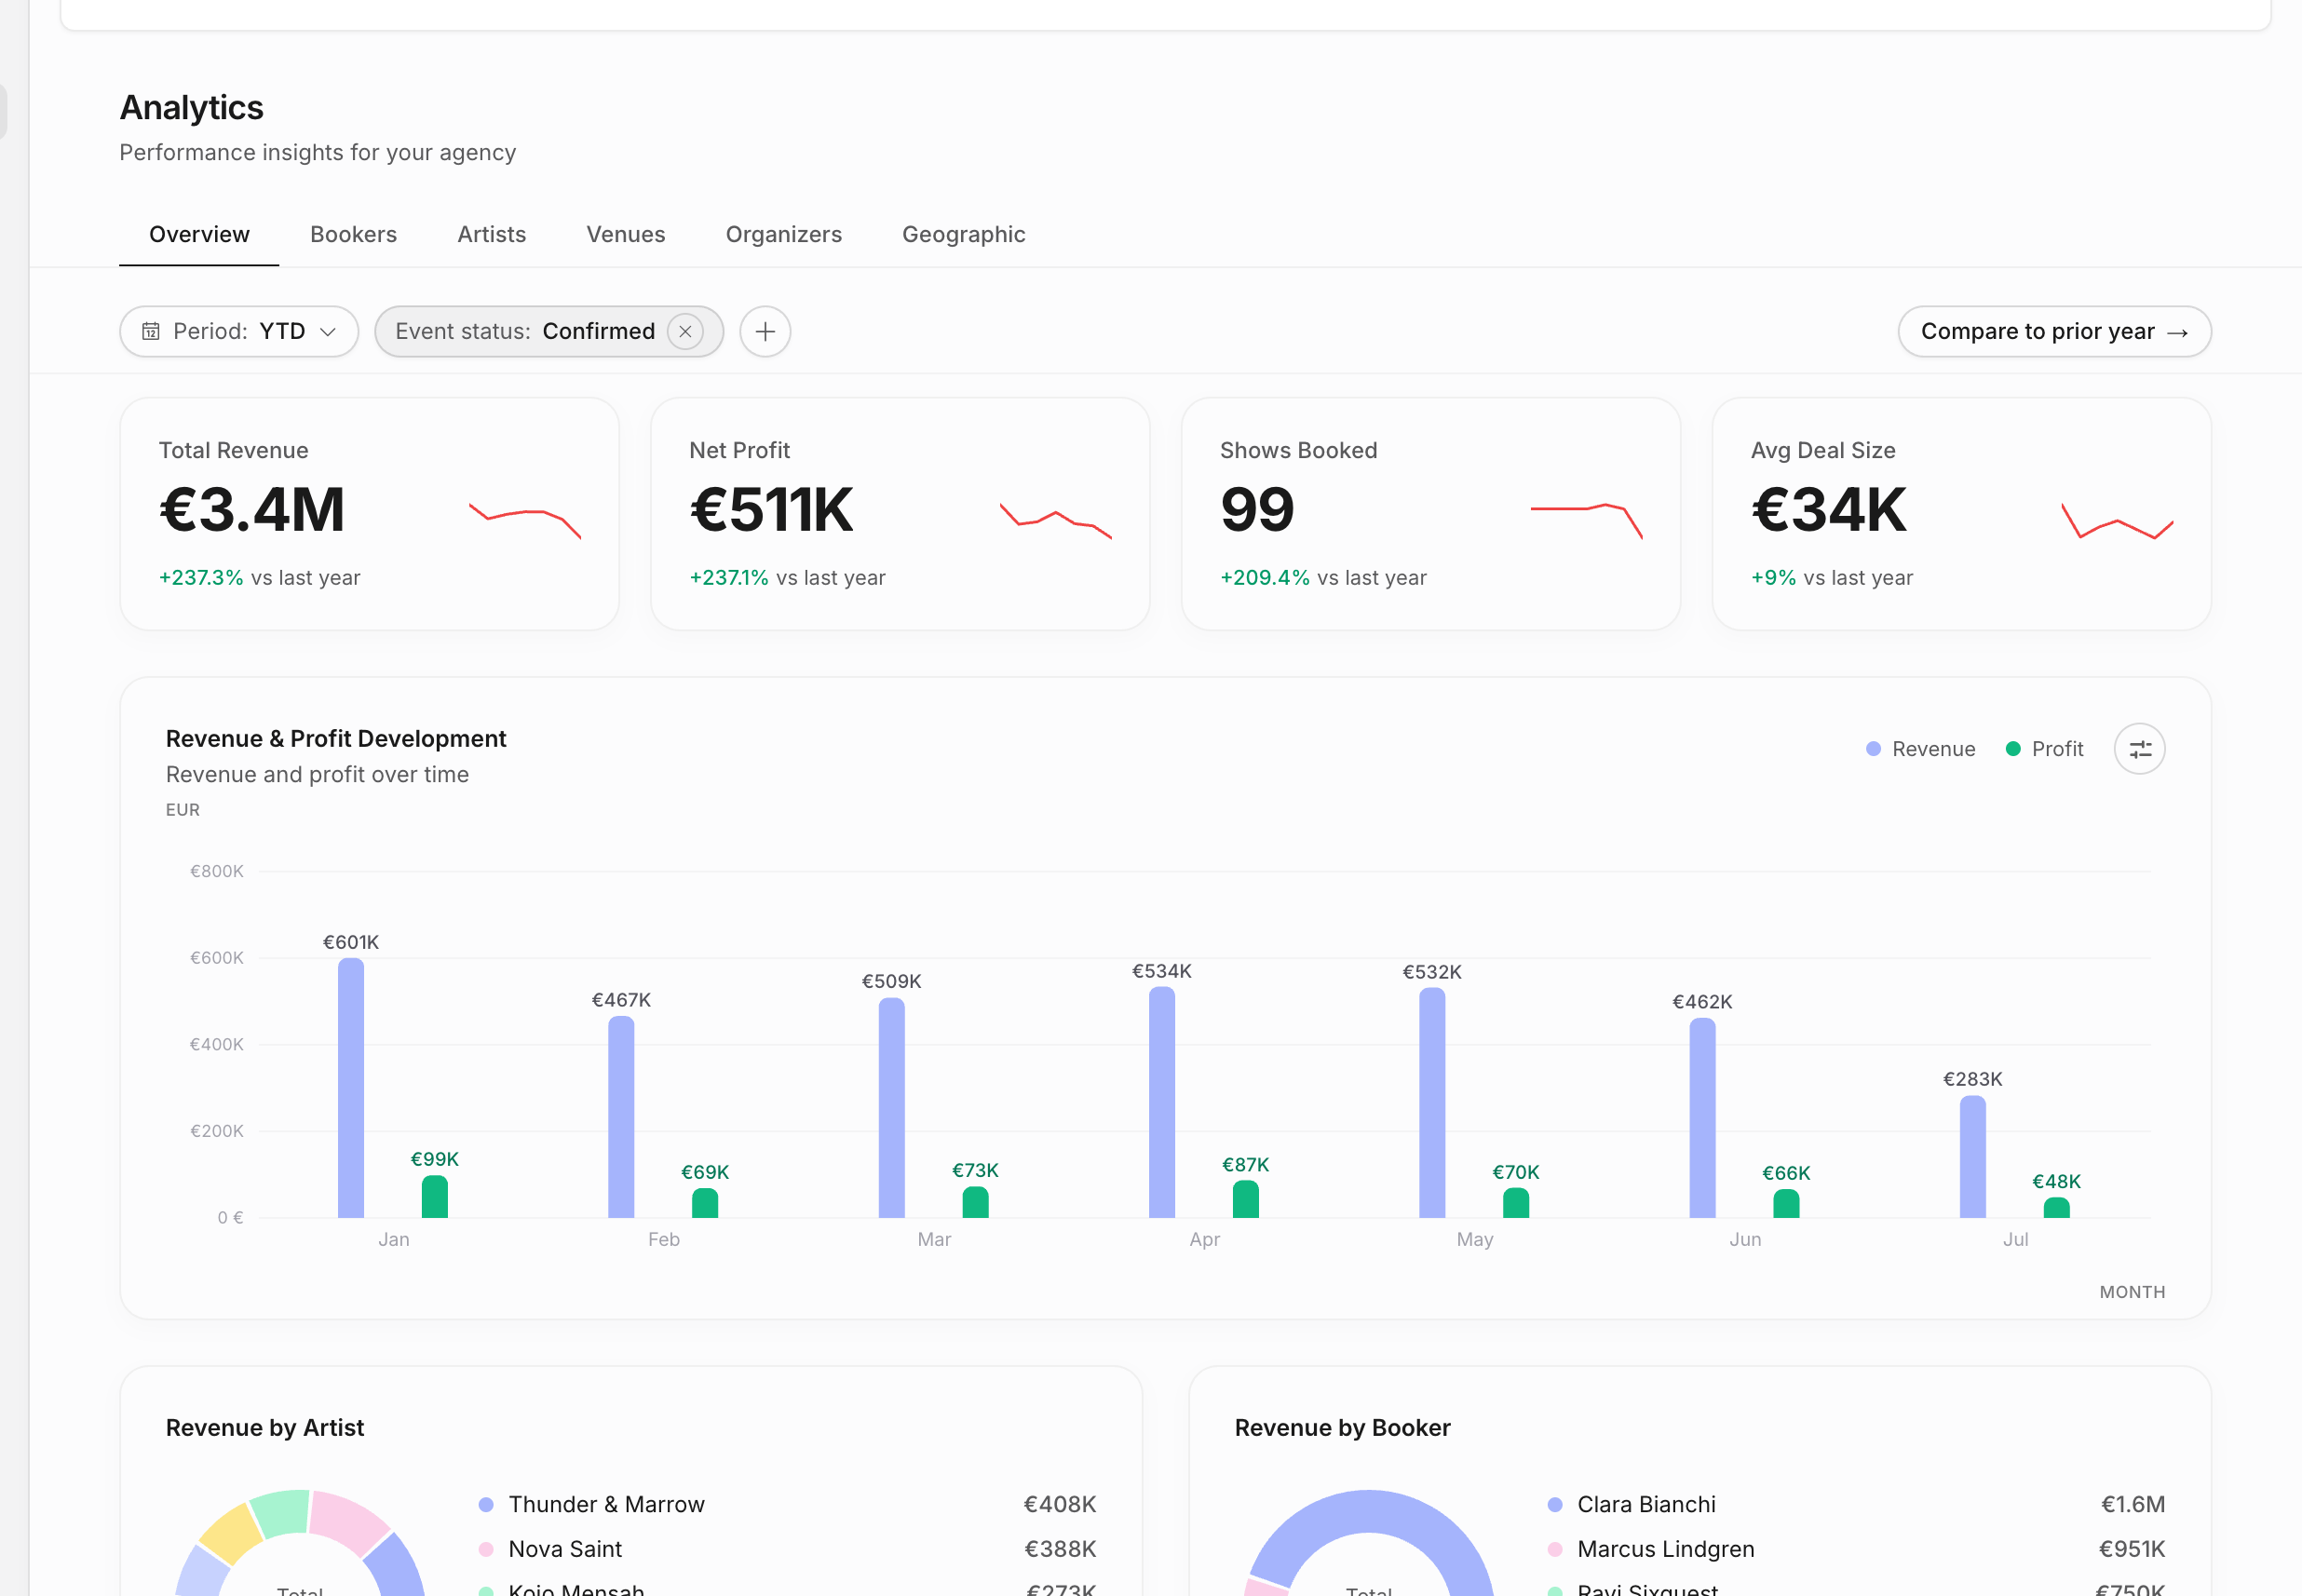
The overview gives you headline numbers for the current analytics scope:
| KPI | What it means |
|---|---|
| Total Revenue | Sum of revenue line items on the events included by the current filters. |
| Net Profit | Revenue minus expense line items. |
| Shows Booked | Count of events in the current period and filter set. |
| Avg Deal Size | Revenue divided by shows booked. |
The monthly trend chart shows revenue and profit over time. Its display options can show or hide profit, show prior-year bars when prior data is available, and switch between monthly and yearly aggregation. Clicking a month or year opens the shows behind that bar, so the chart is an entry point into the underlying records.
If your role only grants Analytics access for shows where you are the booker, the Analytics views only reflect those booked shows. The tutorial quest explains that scoped access in its first beat.
Filter the dataset
Analytics filters live in the URL, so a filtered view can be bookmarked or shared with another teammate who has access. The filter bar includes the period and optional dimensions:
| Filter | What it changes |
|---|---|
| Period | This month, this quarter, YTD, last 12 months, last year, all time, upcoming, rest of year, next 12 months, or a custom date range. |
| Event status | Which event statuses count. The default landing state is confirmed events. |
| Invoice status | Limits analytics to events with at least one invoice in the selected invoice state. Leave it off when you do not want invoice lifecycle to constrain the business view. |
| Revenue | Filters by per-event revenue range. |
| Artist | Limits analytics to selected artists. |
| Booker | Limits analytics to selected bookers. |
| Country | Limits analytics to selected countries. |
| Organizer type | Limits buyer-side contacts by contact type. |
| Capacity | Filters by venue capacity range. |
These filters apply across all Analytics tabs. Filtering by booker on Geographic, for example, shows where that booker's events happen. Filtering by artist on Bookers shows which bookers are responsible for that artist's events.
Use the lenses
| Lens | What it helps answer |
|---|---|
| Overview | What is the agency-wide commercial picture for this filtered period? |
| Bookers | How is team performance distributed across booked shows? |
| Artists | Which roster acts are driving revenue, repeat work, margin, and concentration? |
| Venues | Which rooms produce the strongest results, repeat rate, and city mix? |
| Organizers | Which buyers, promoters, agencies, or other organizers matter most, and how healthy is payment status? |
| Geographic | Which cities or countries are active, growing, concentrated, or underdeveloped? |
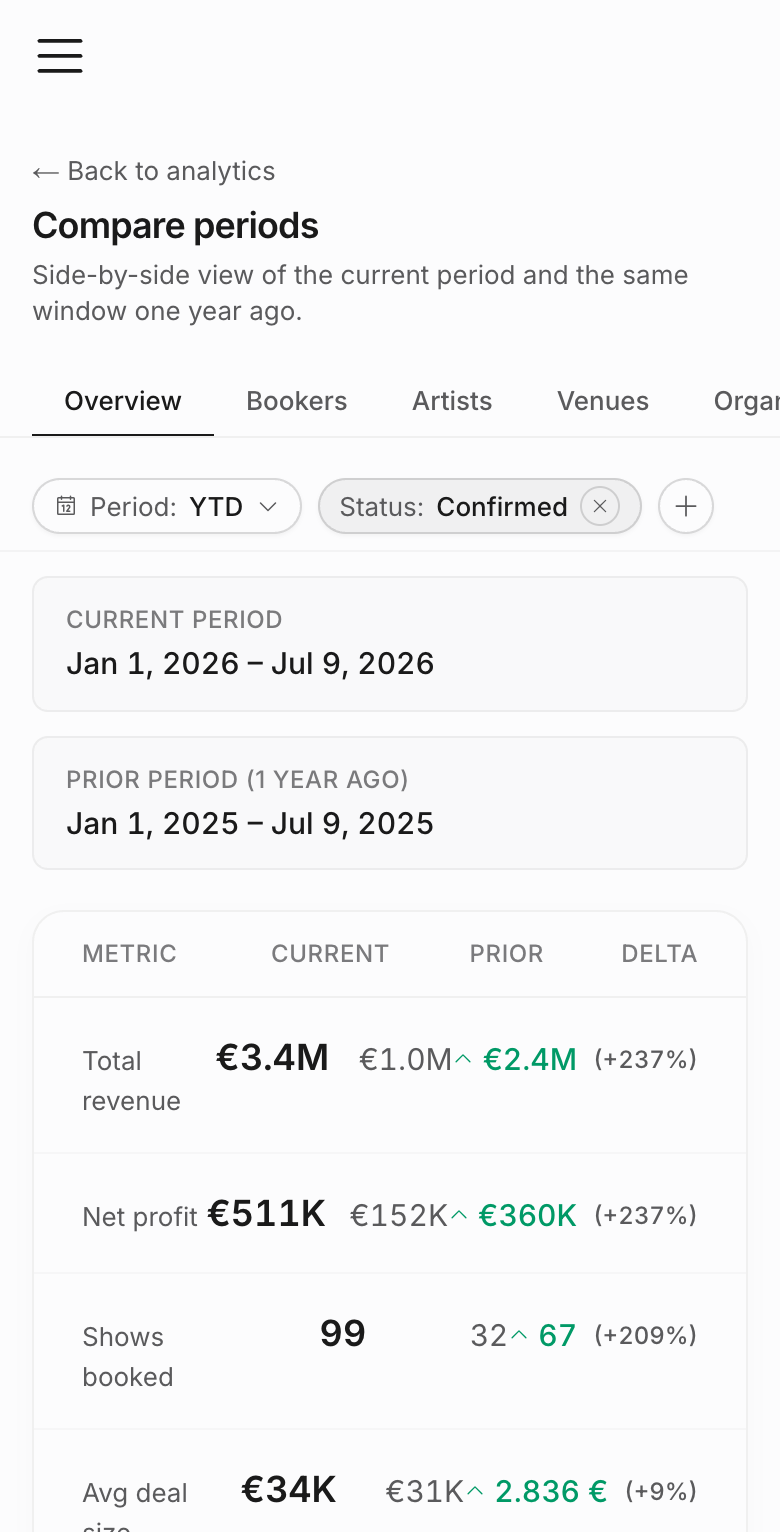
| Compare with prior year | What moved up or down against the same period last year? |
Only the active tab loads its full dataset. That keeps Analytics responsive while still letting every tab use the same period and filter model.
What each tab shows
The tabs are built for different agency questions:
| Tab | Important views |
|---|---|
| Overview | KPI cards, revenue/profit trend, revenue by artist, revenue by booker, booker performance table, booker efficiency chart, and top venues. |
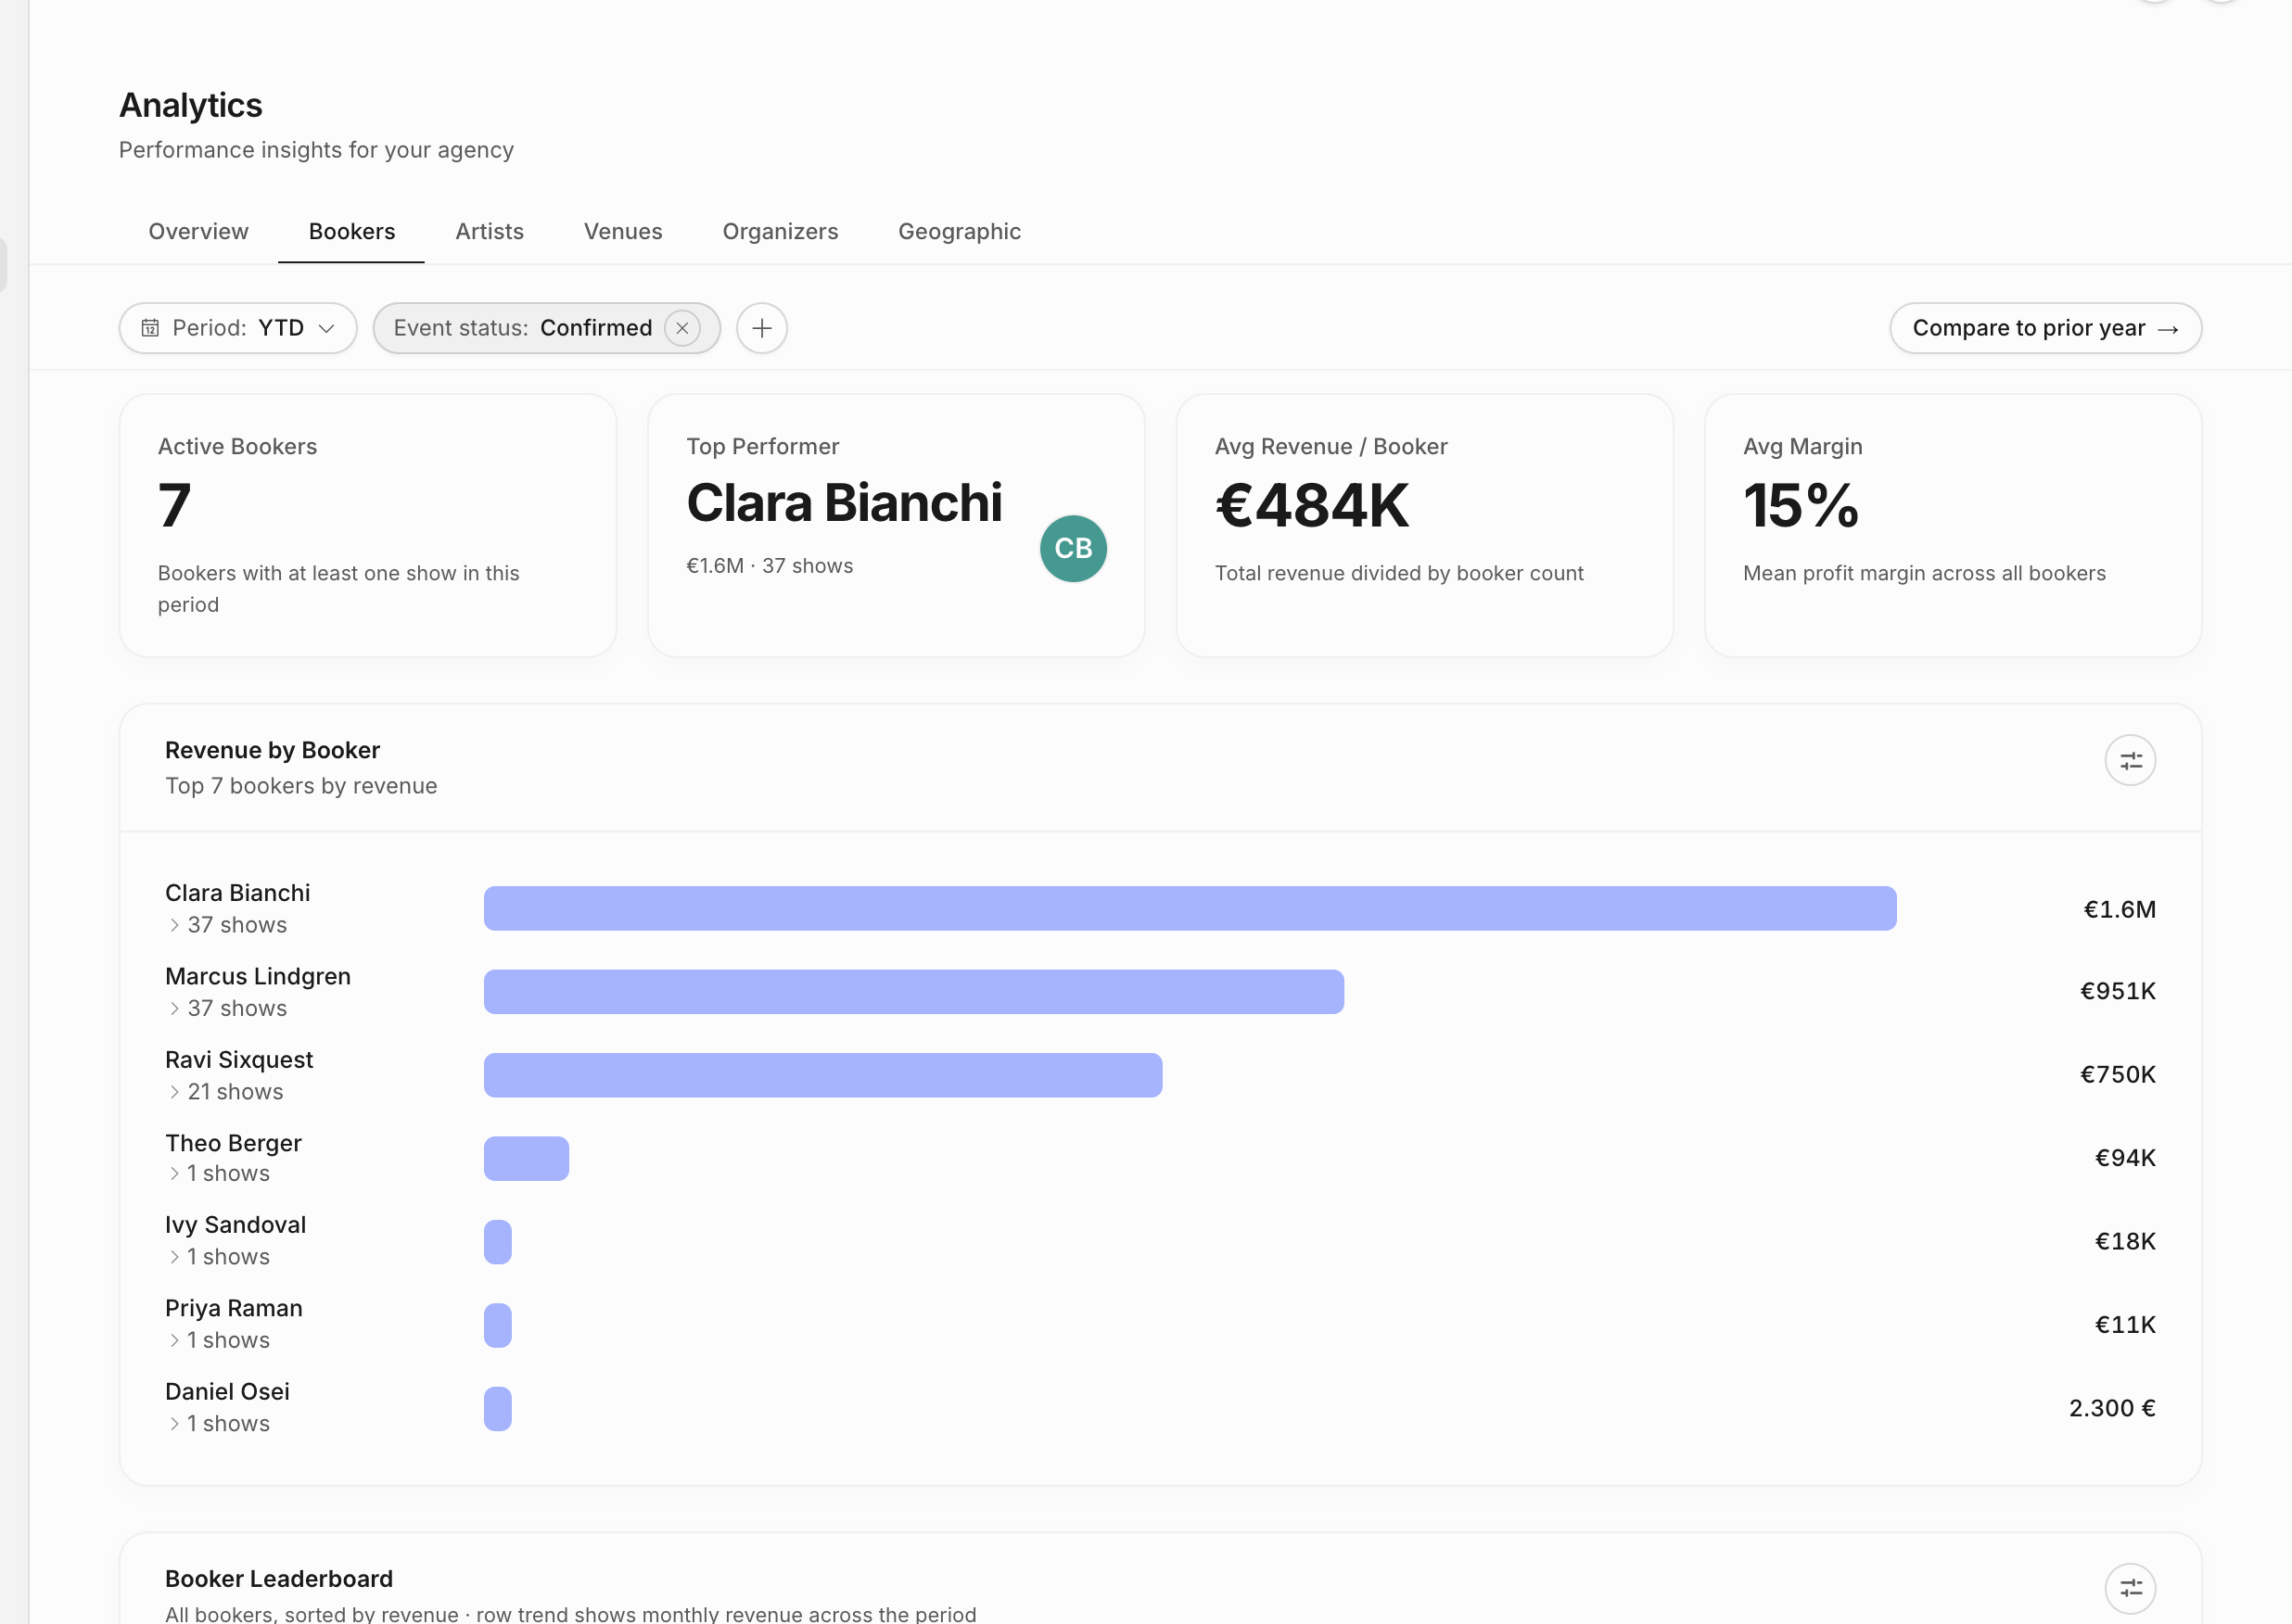
| Bookers | Booker KPI cards, revenue by booker with prior-year comparison, leaderboard, efficiency chart, per-booker trends, and deal-size distribution. |
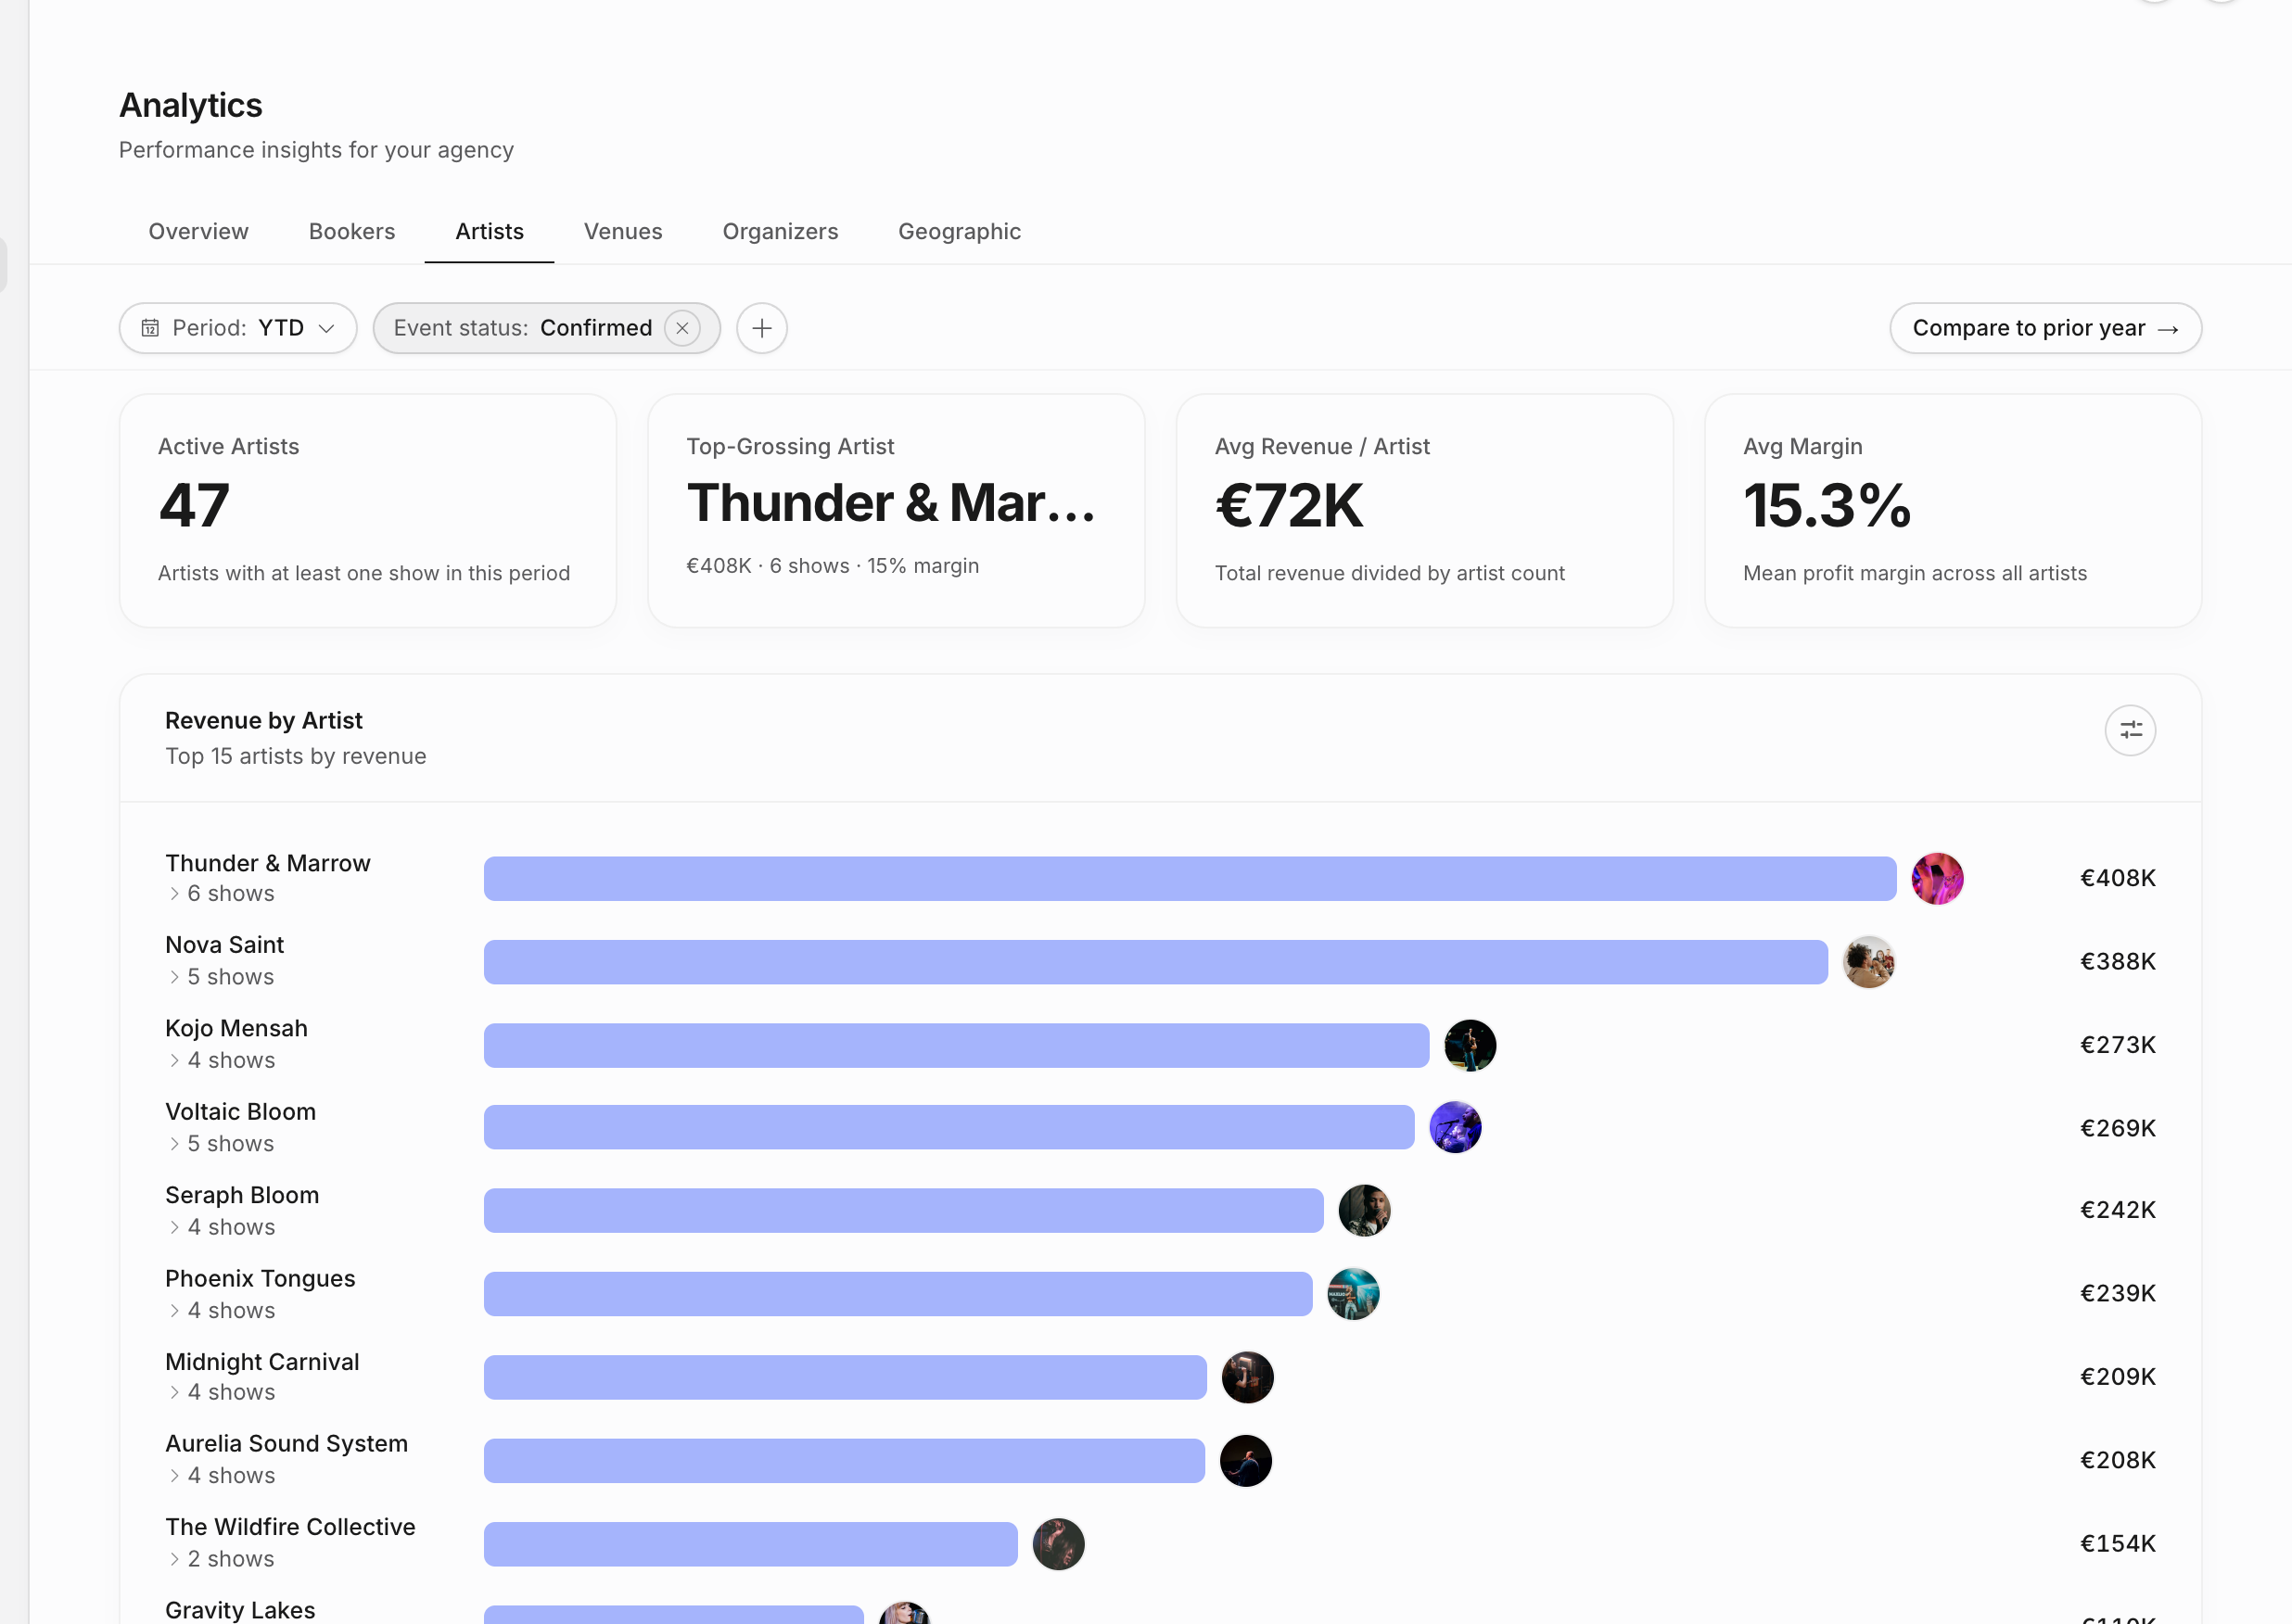
| Artists | Artist KPI cards, revenue by artist, roster table, new vs repeat artist revenue, ROI scatter, revenue concentration, tier mix, genre revenue, and per-artist trends. |
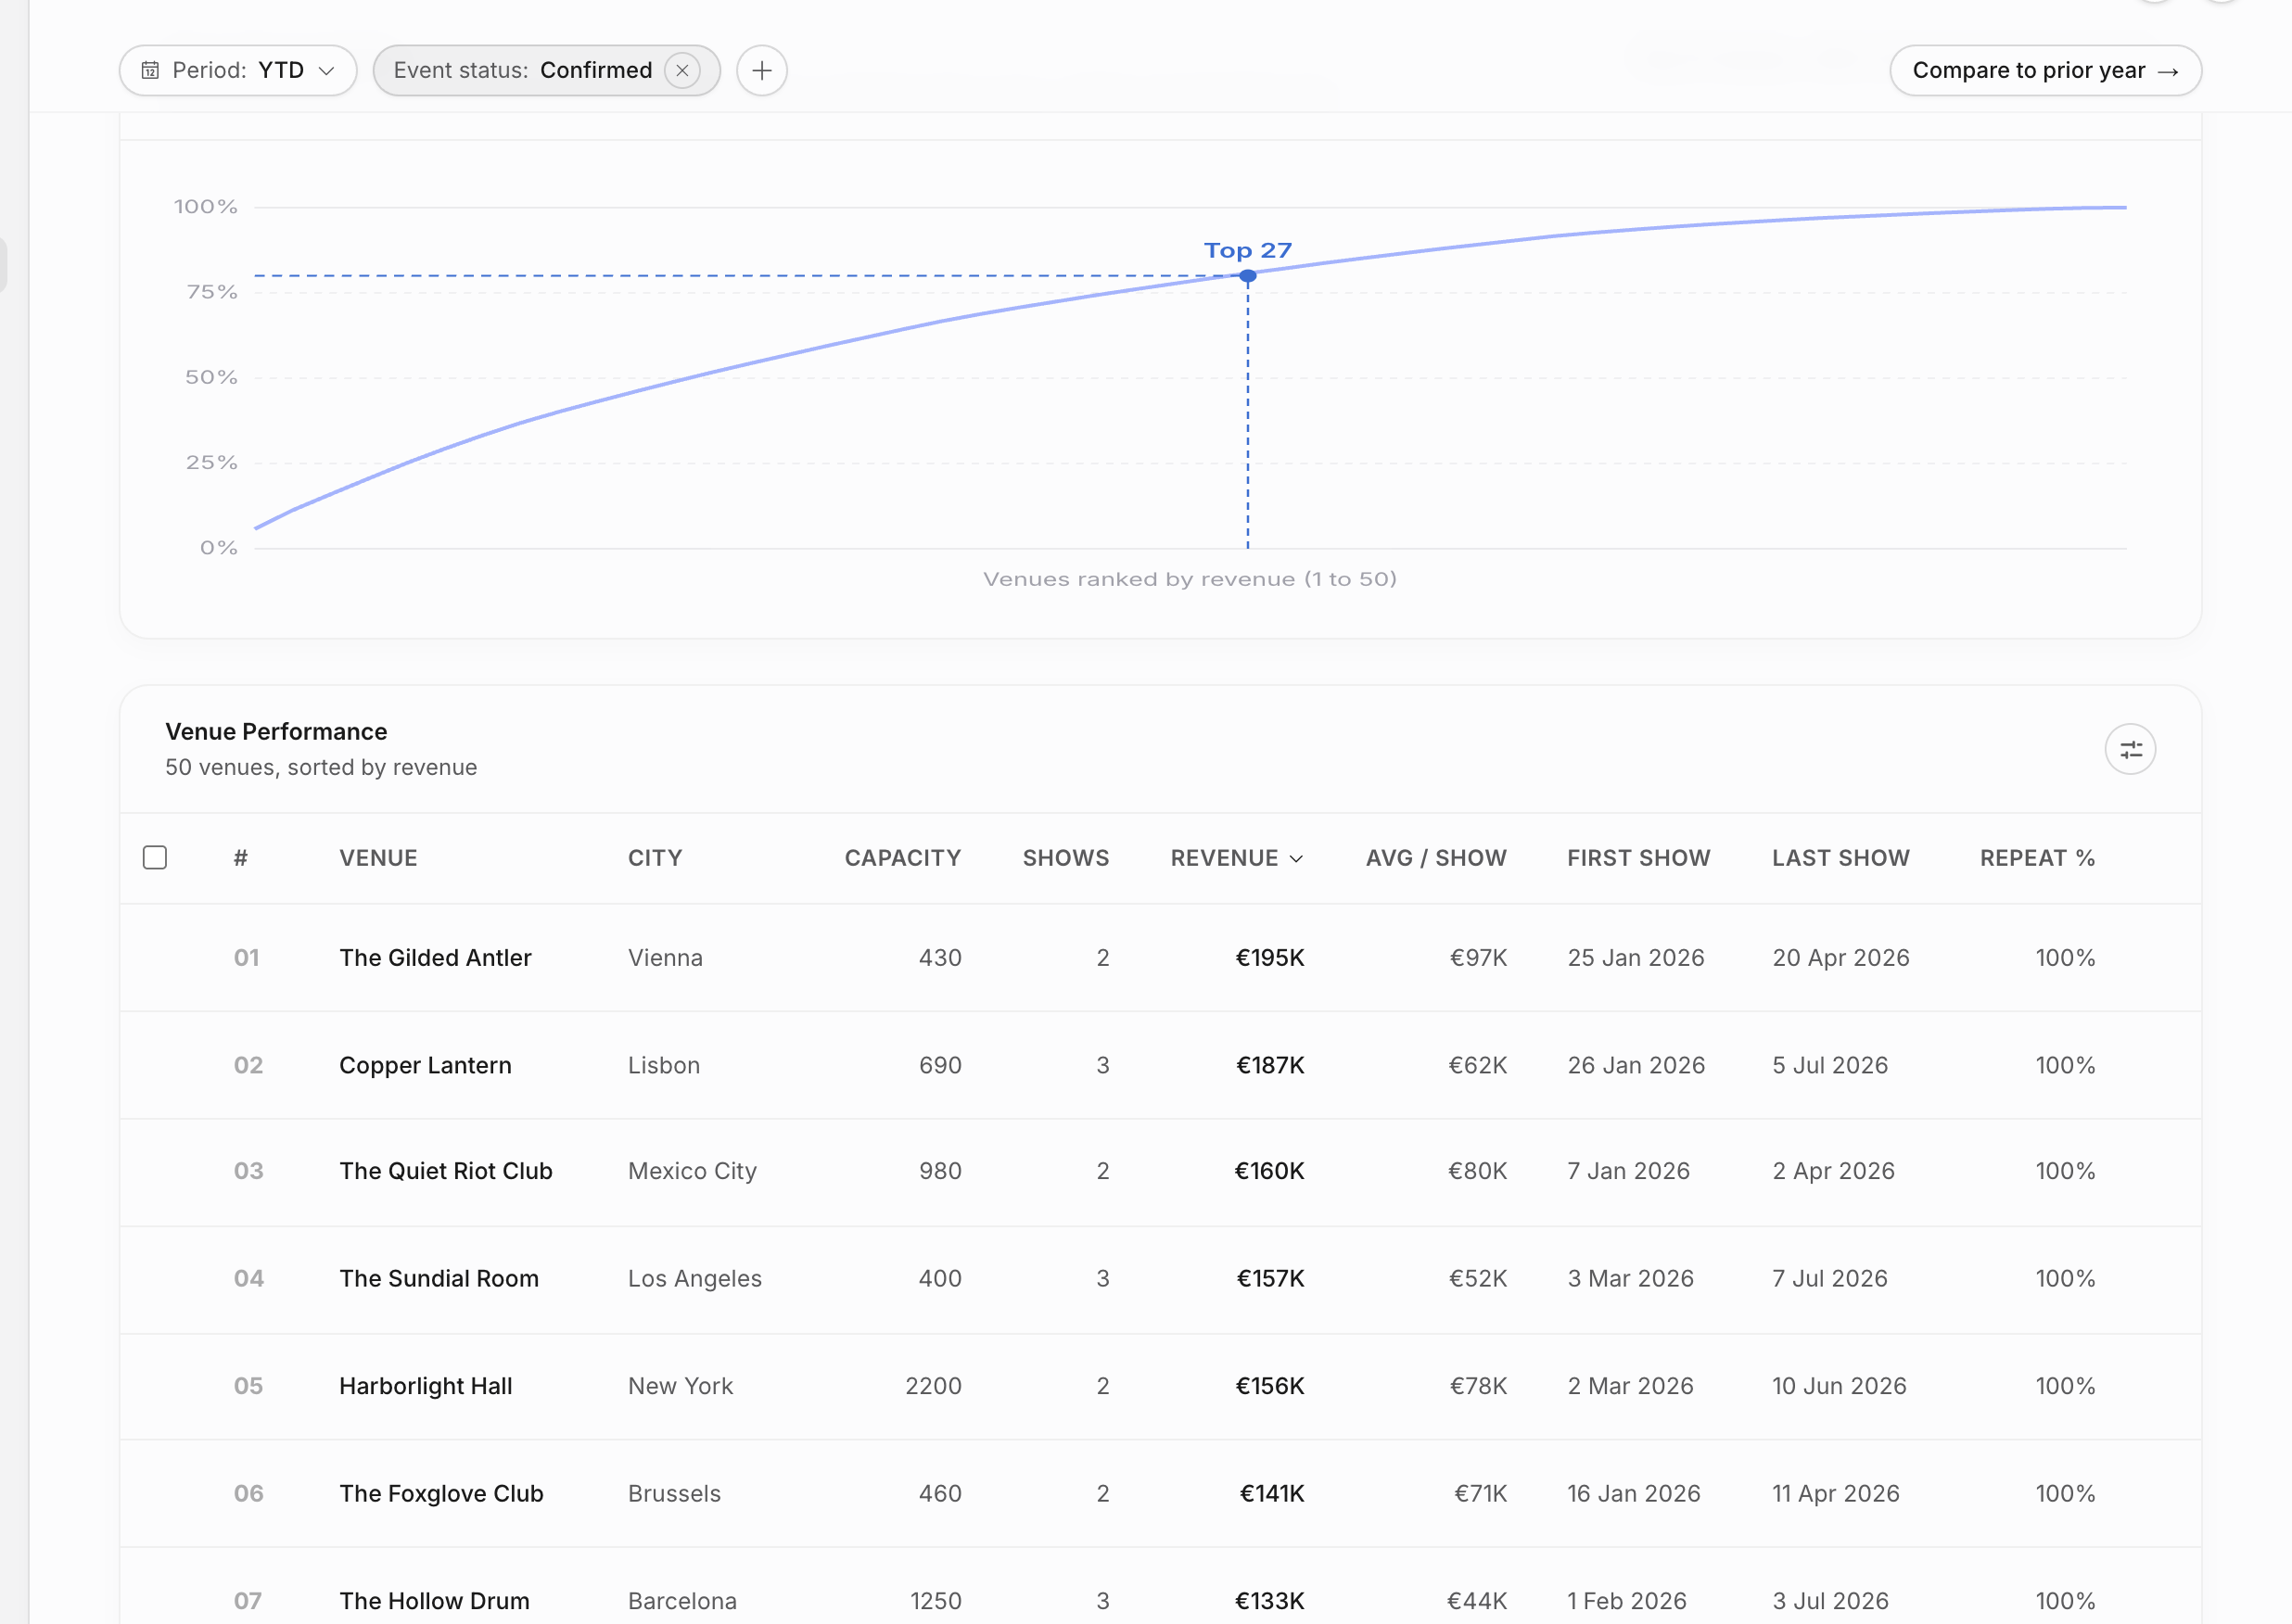
| Venues | Venue KPI cards, revenue by city, new vs repeat venue revenue, venue concentration, and deep venue table. |
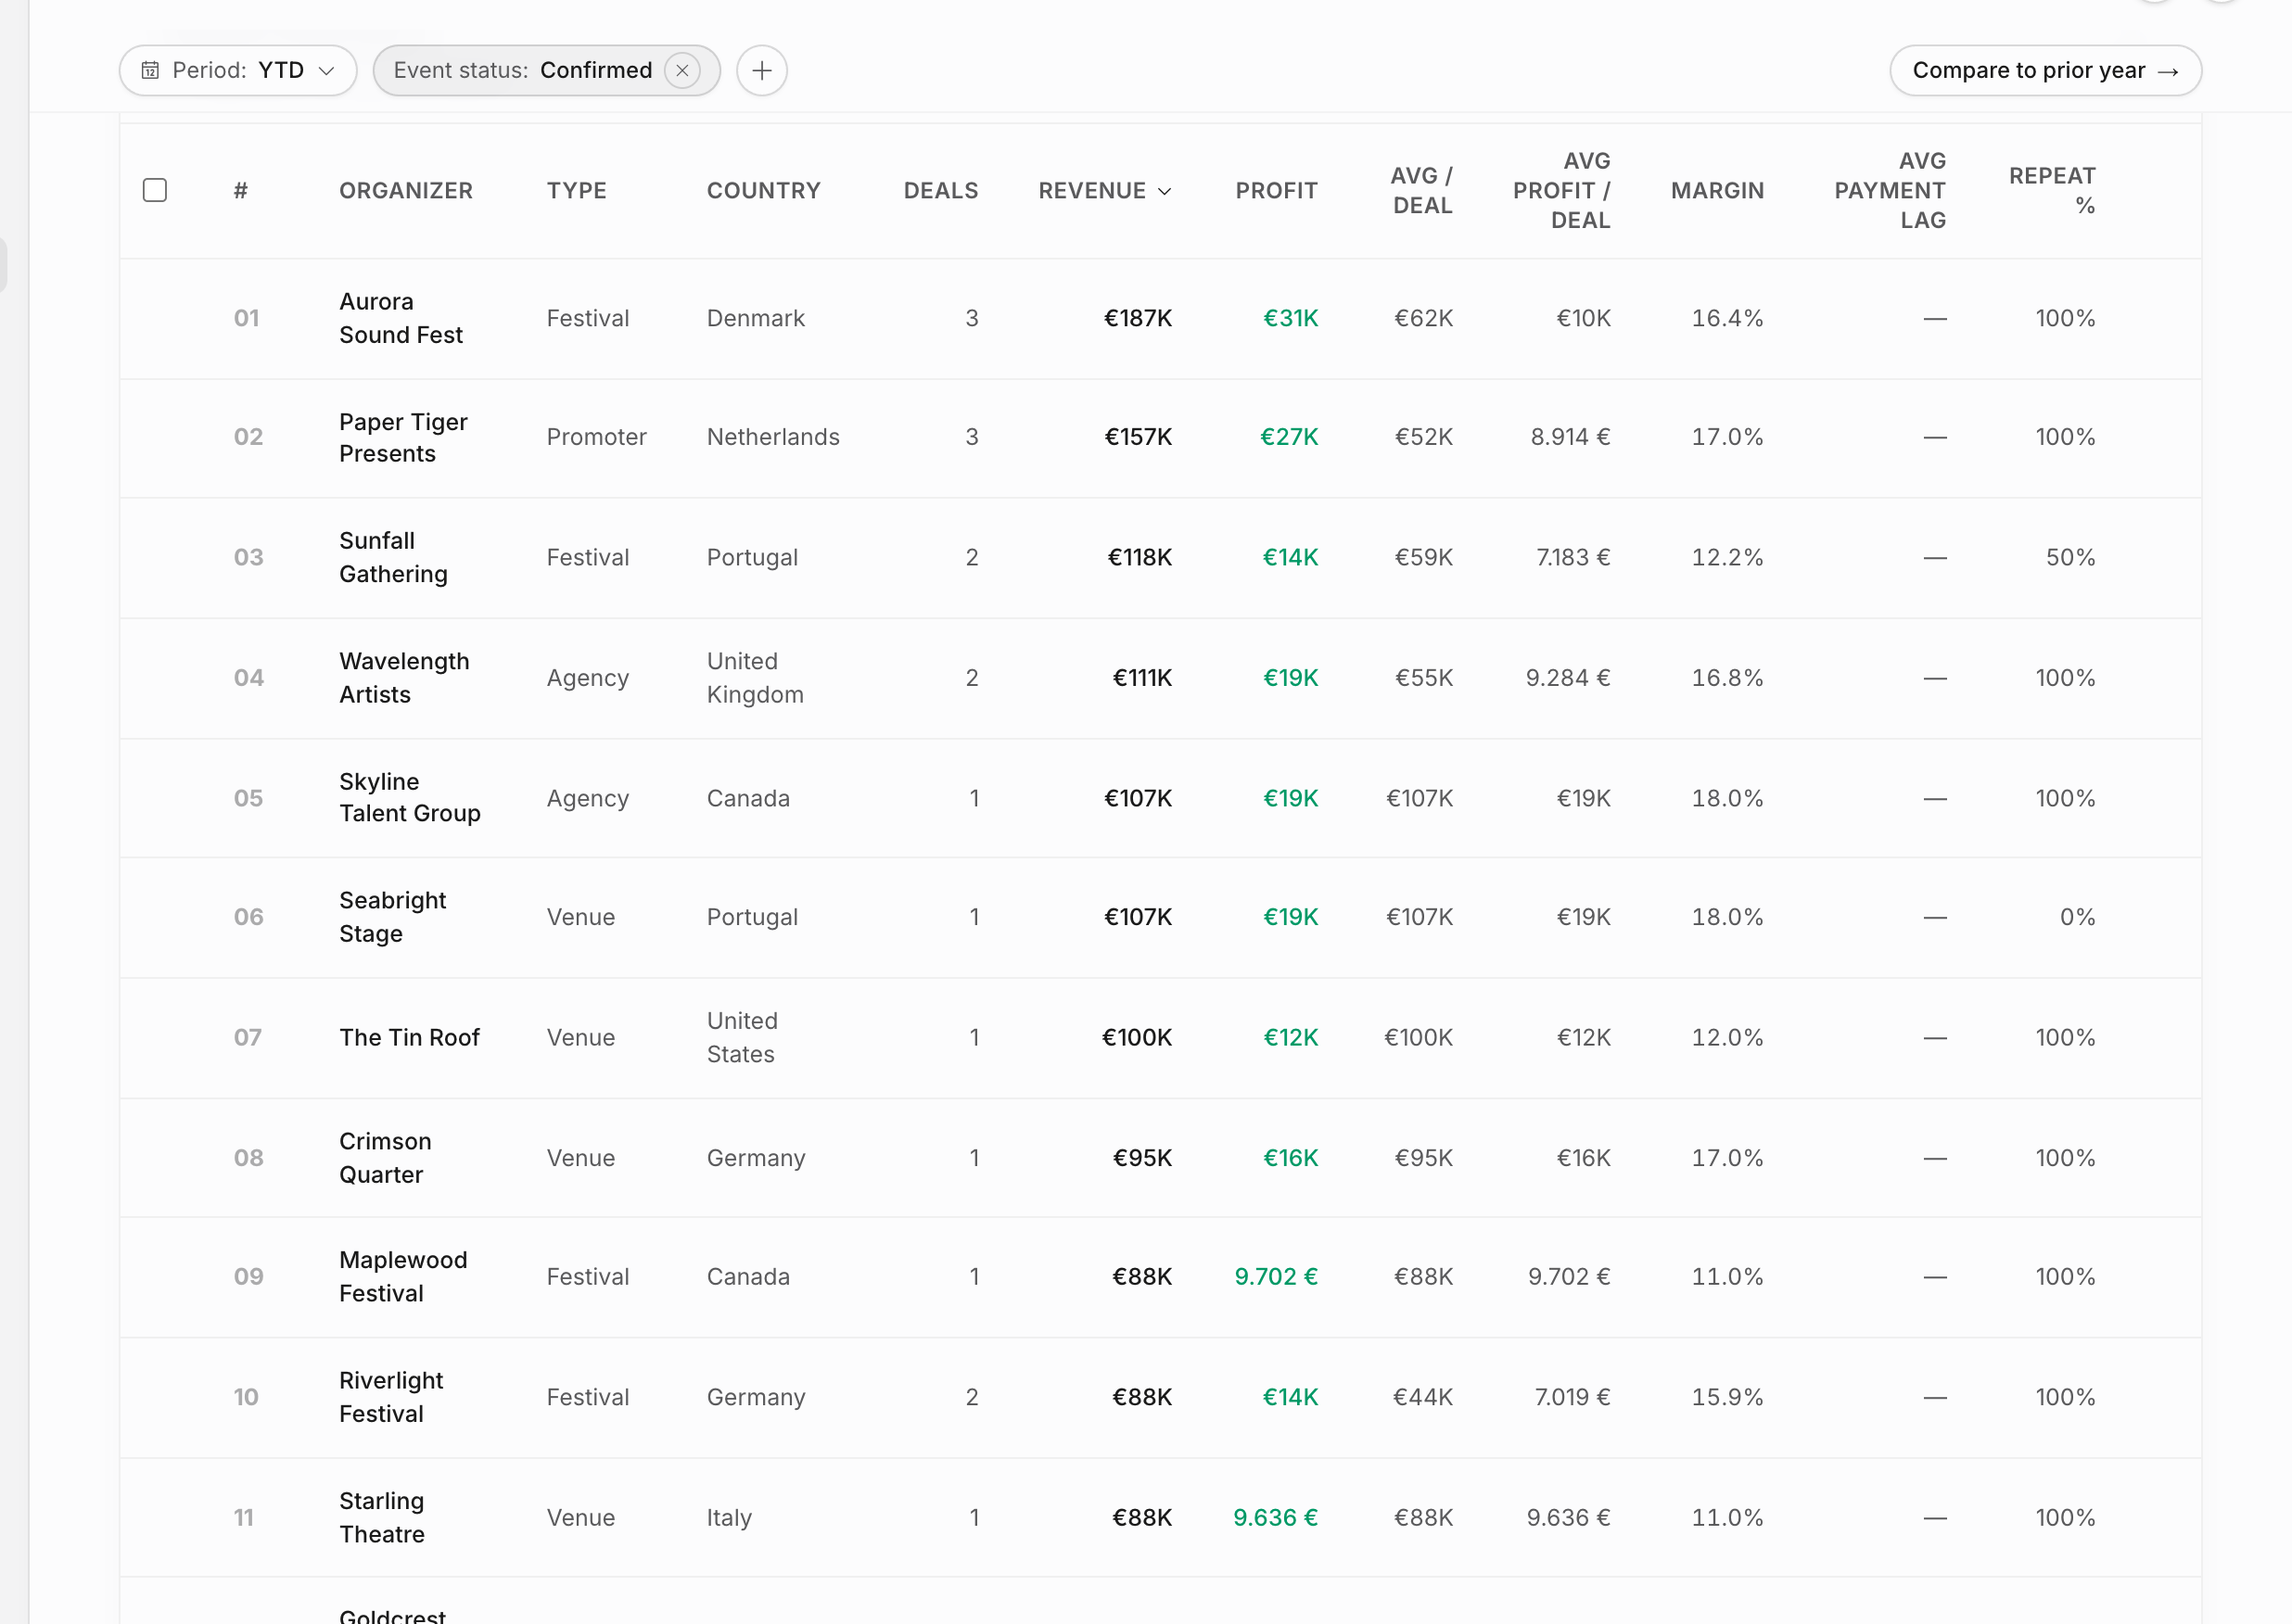
| Organizers | Organizer KPI cards, organizer concentration, and deep organizer table with type, country, deals, revenue, profit, margin, payment lag, and repeat percentage. |
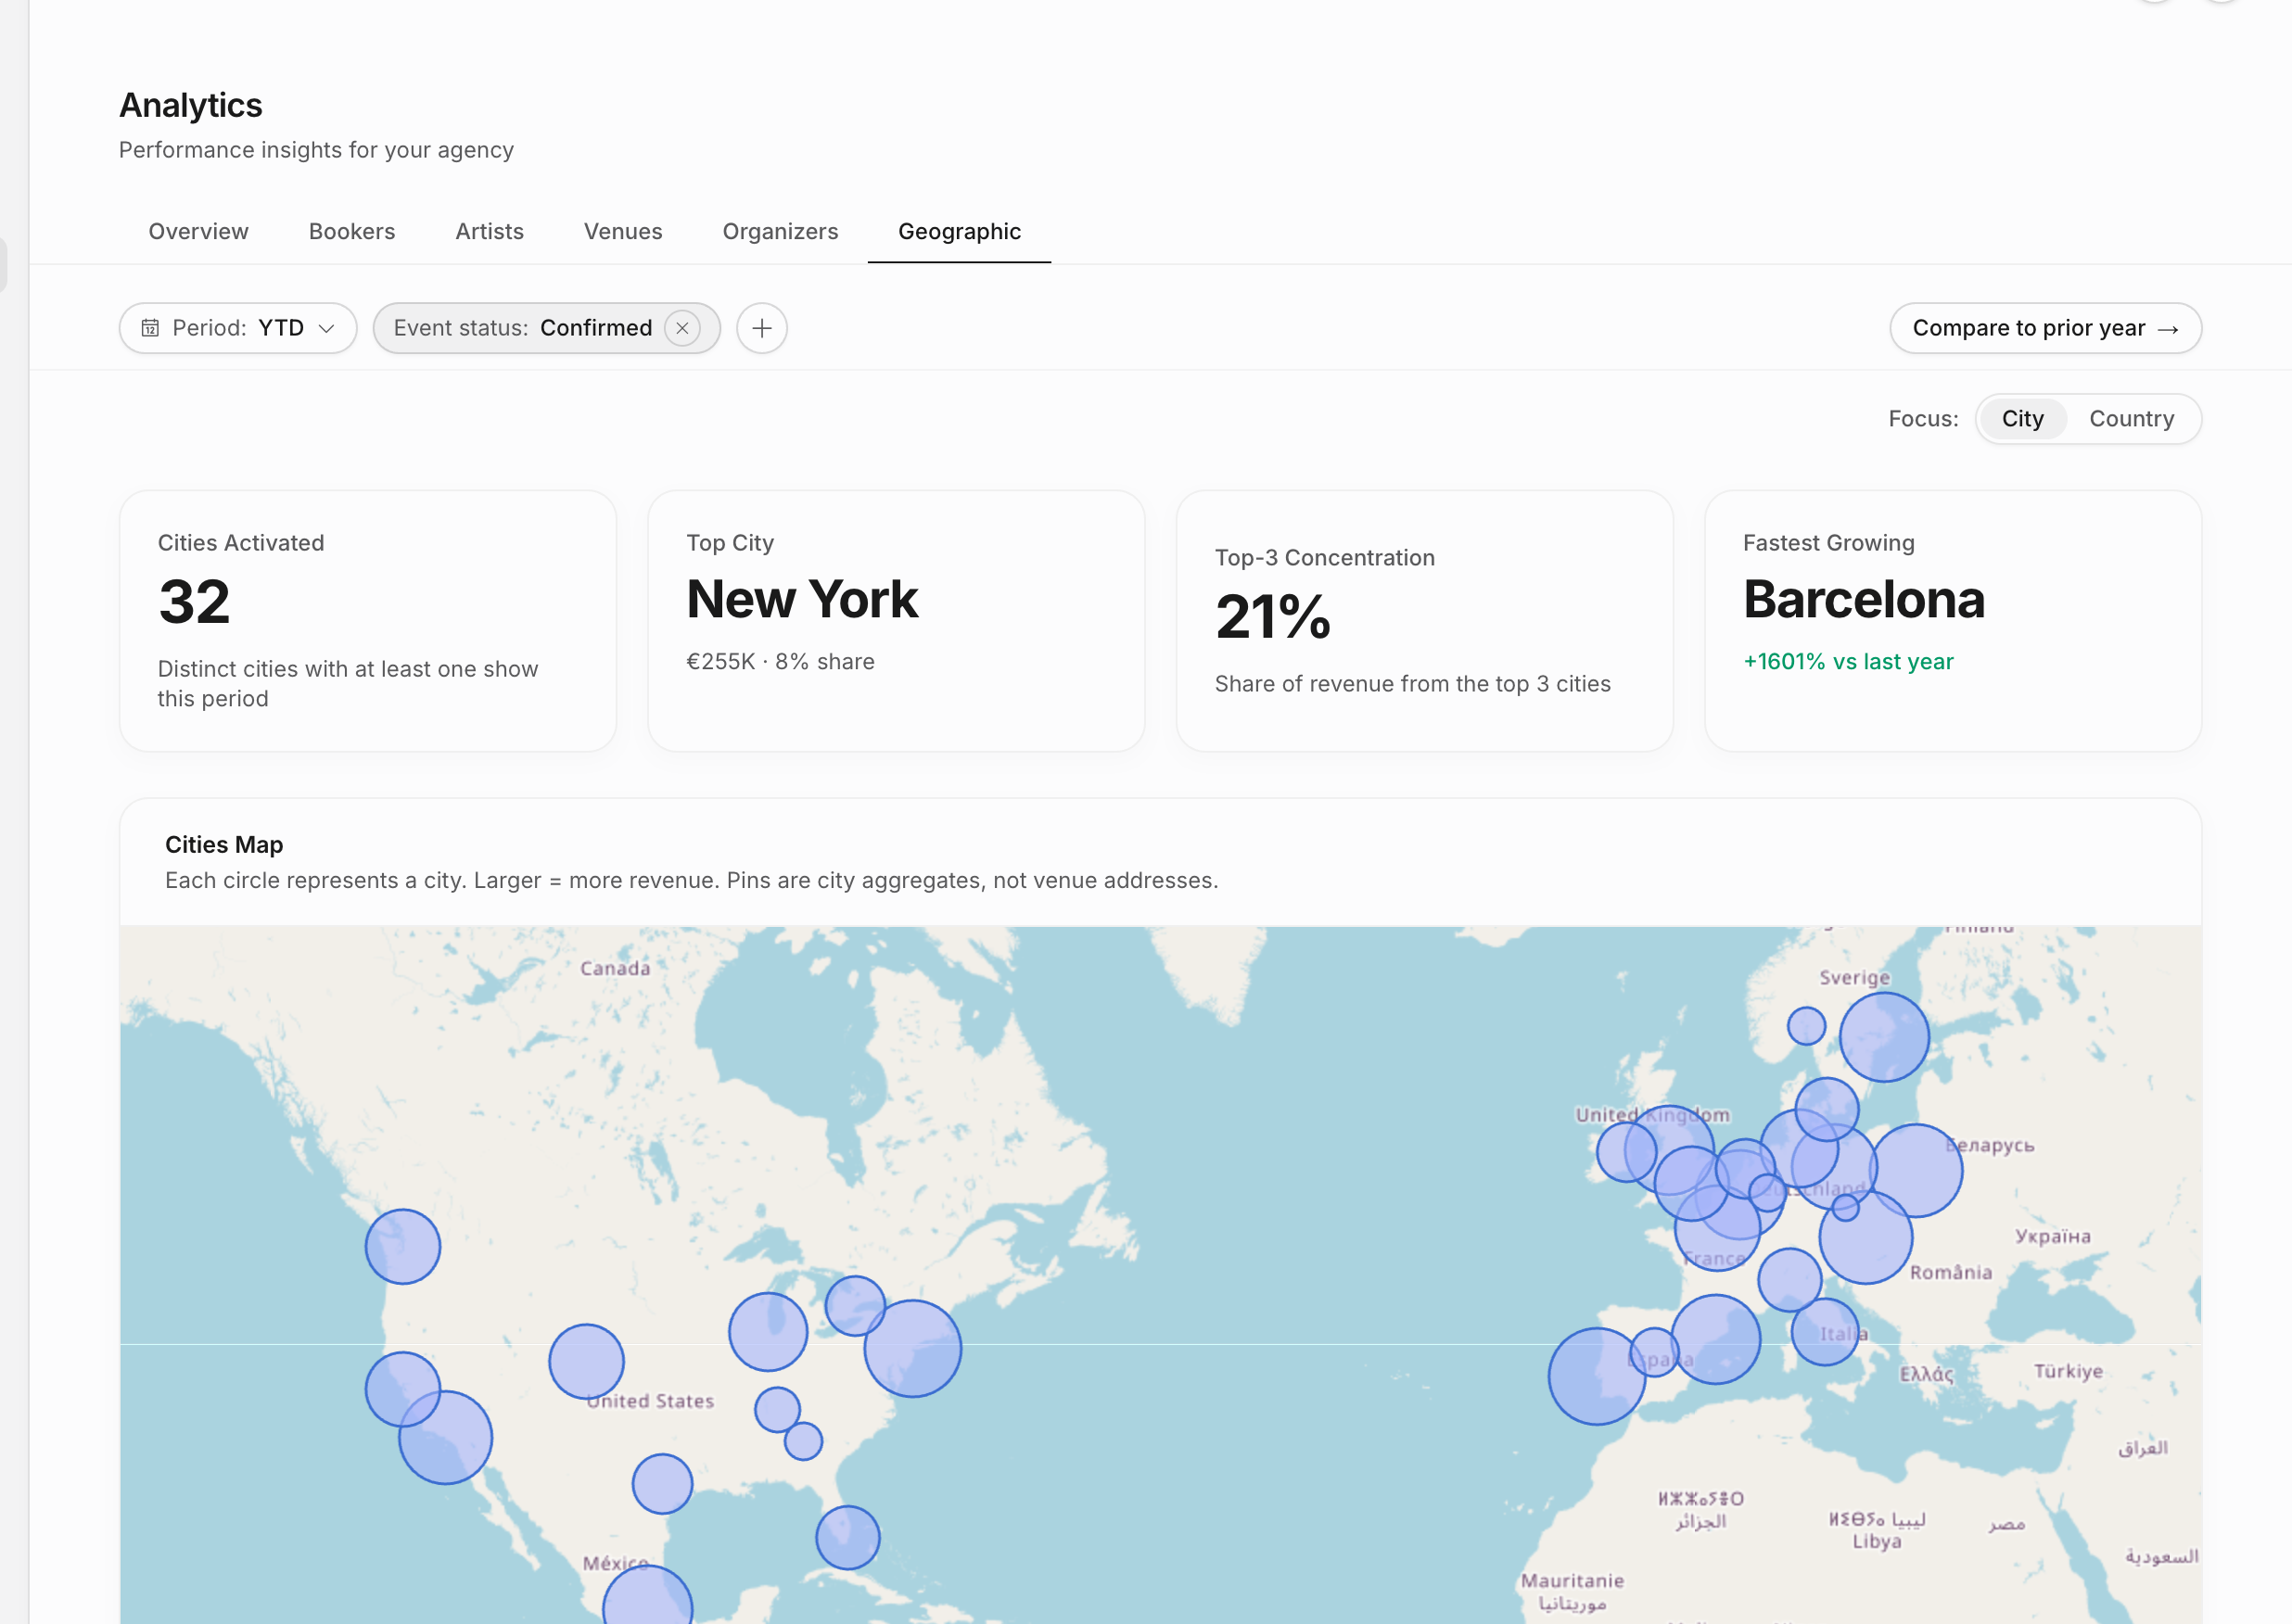
| Geographic | City or country focus, regional KPIs, map, revenue bars, concentration over time, market growth tables, and all-region table. |
Rows are interactive. You can open a full detail page, preview an entity, copy a link, compare entities, or select rows for bulk comparison when those actions are available.
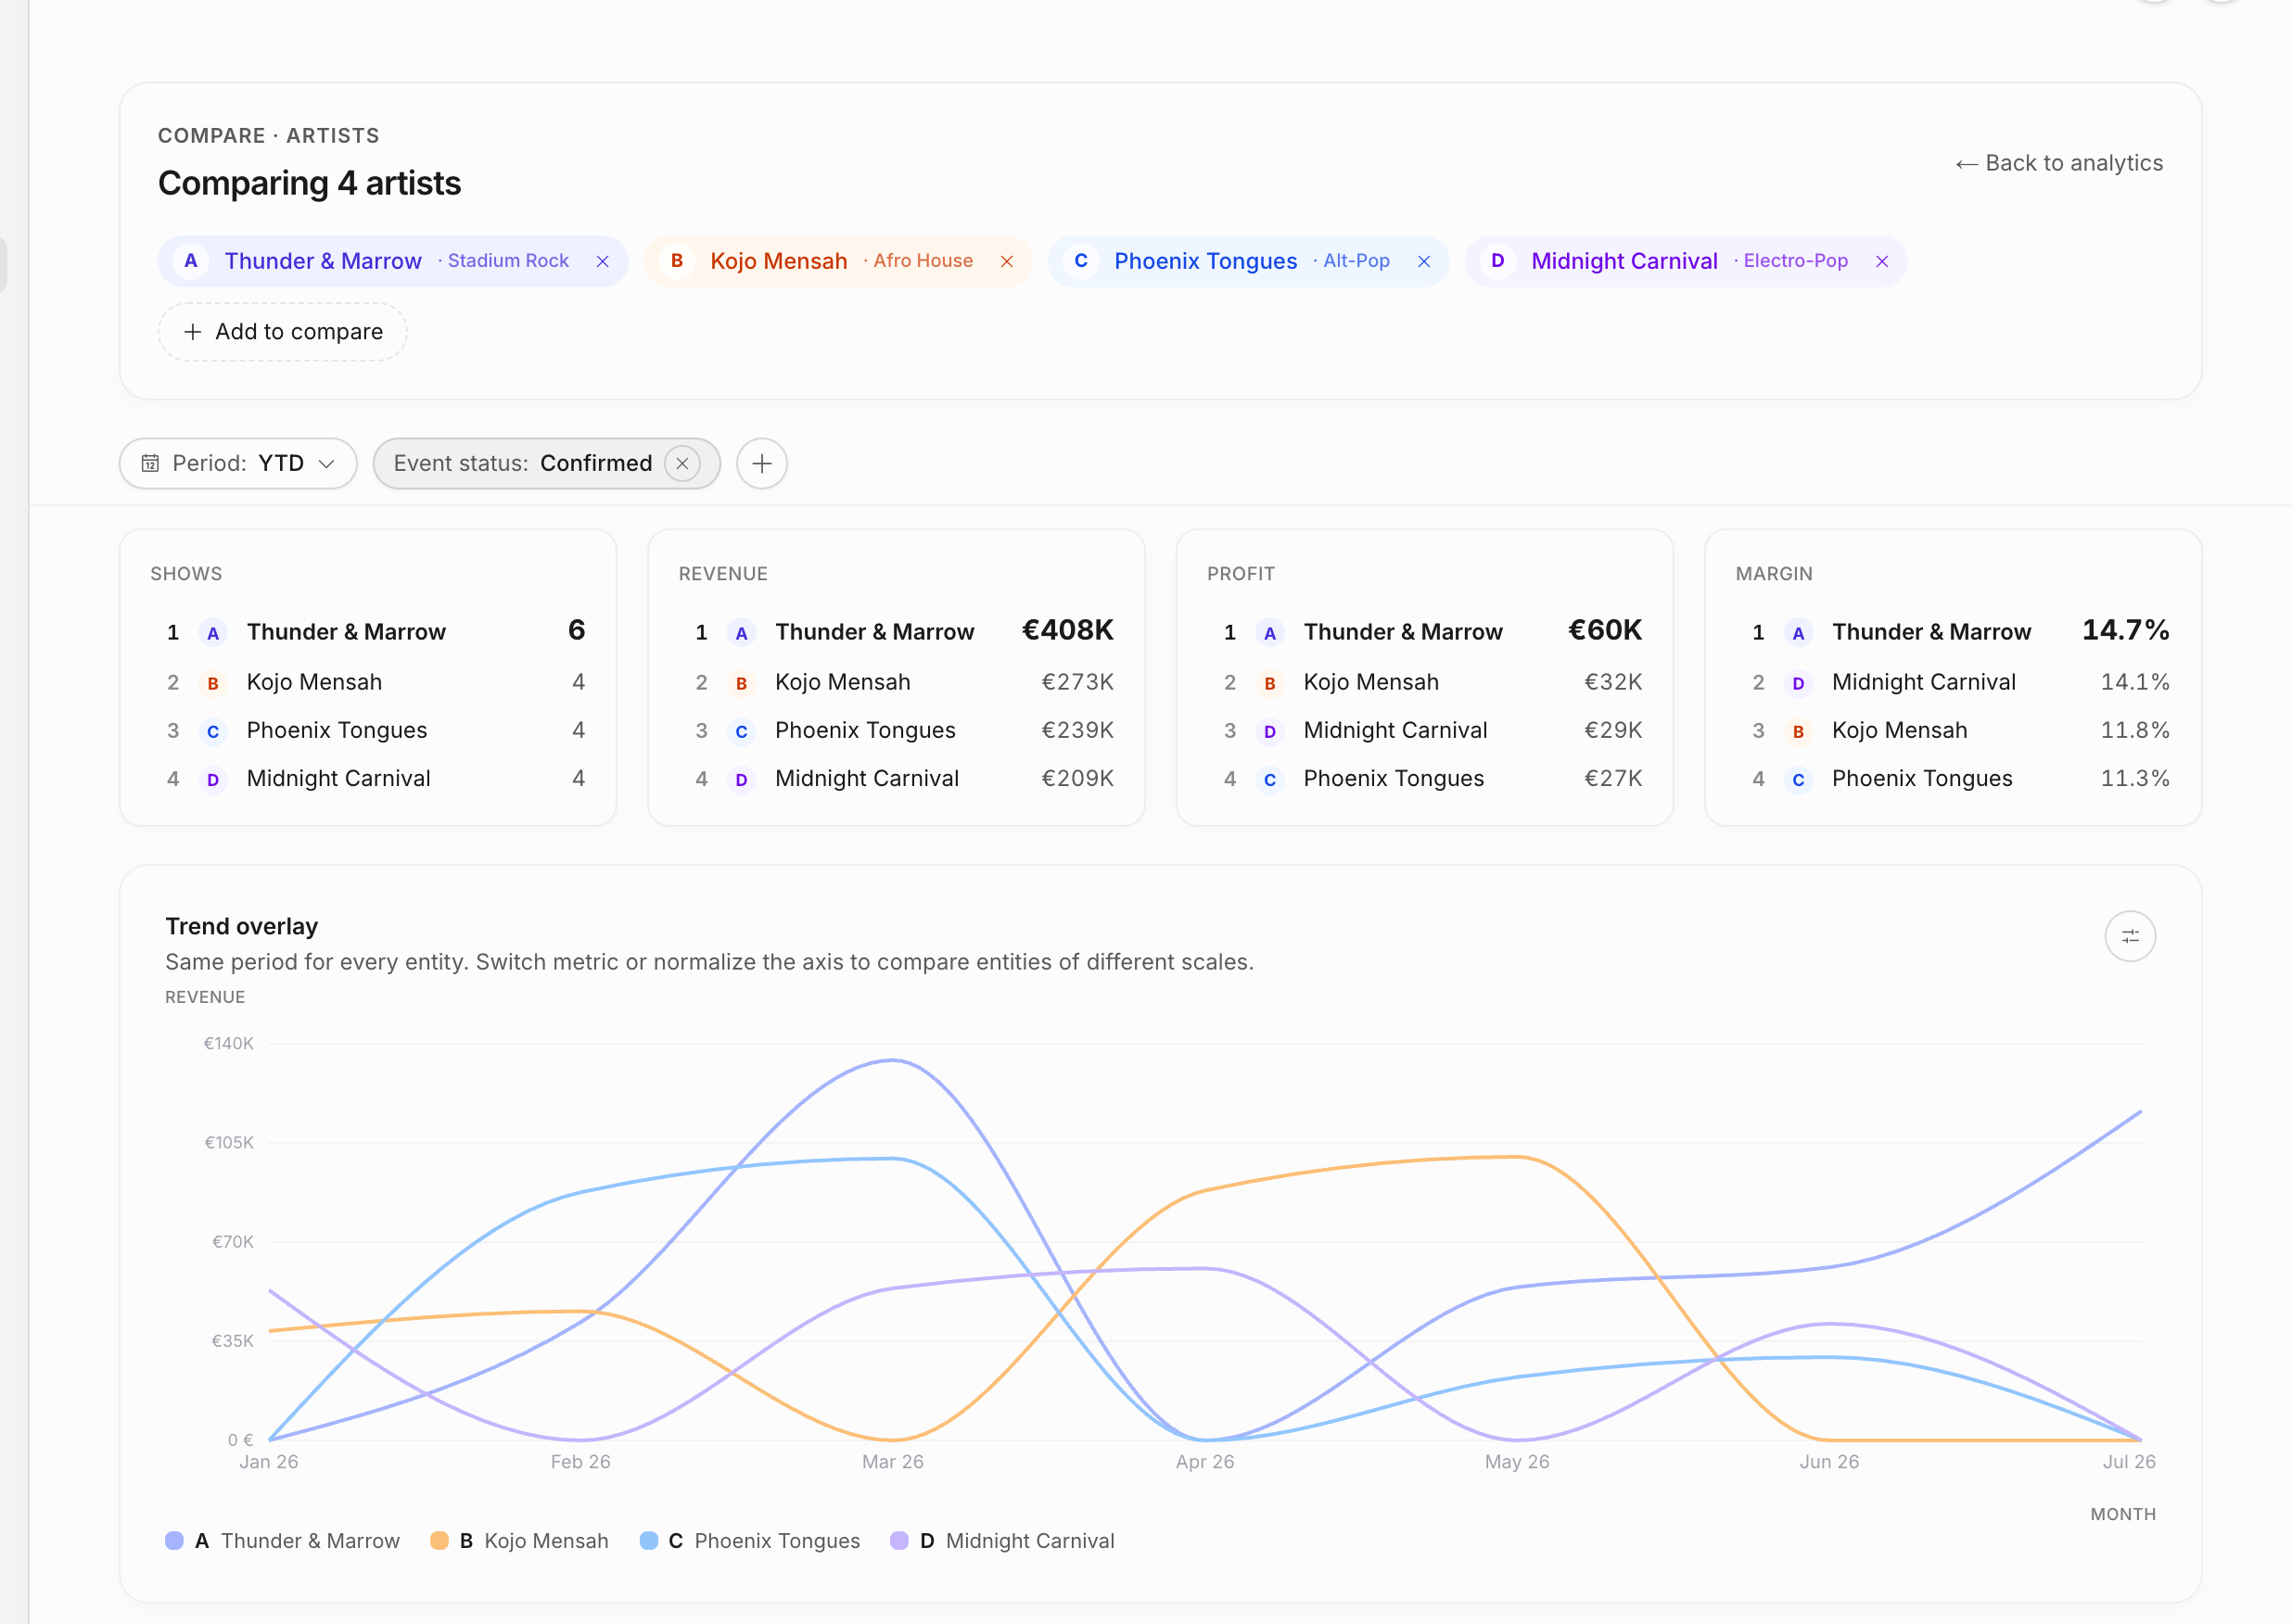
Drill down
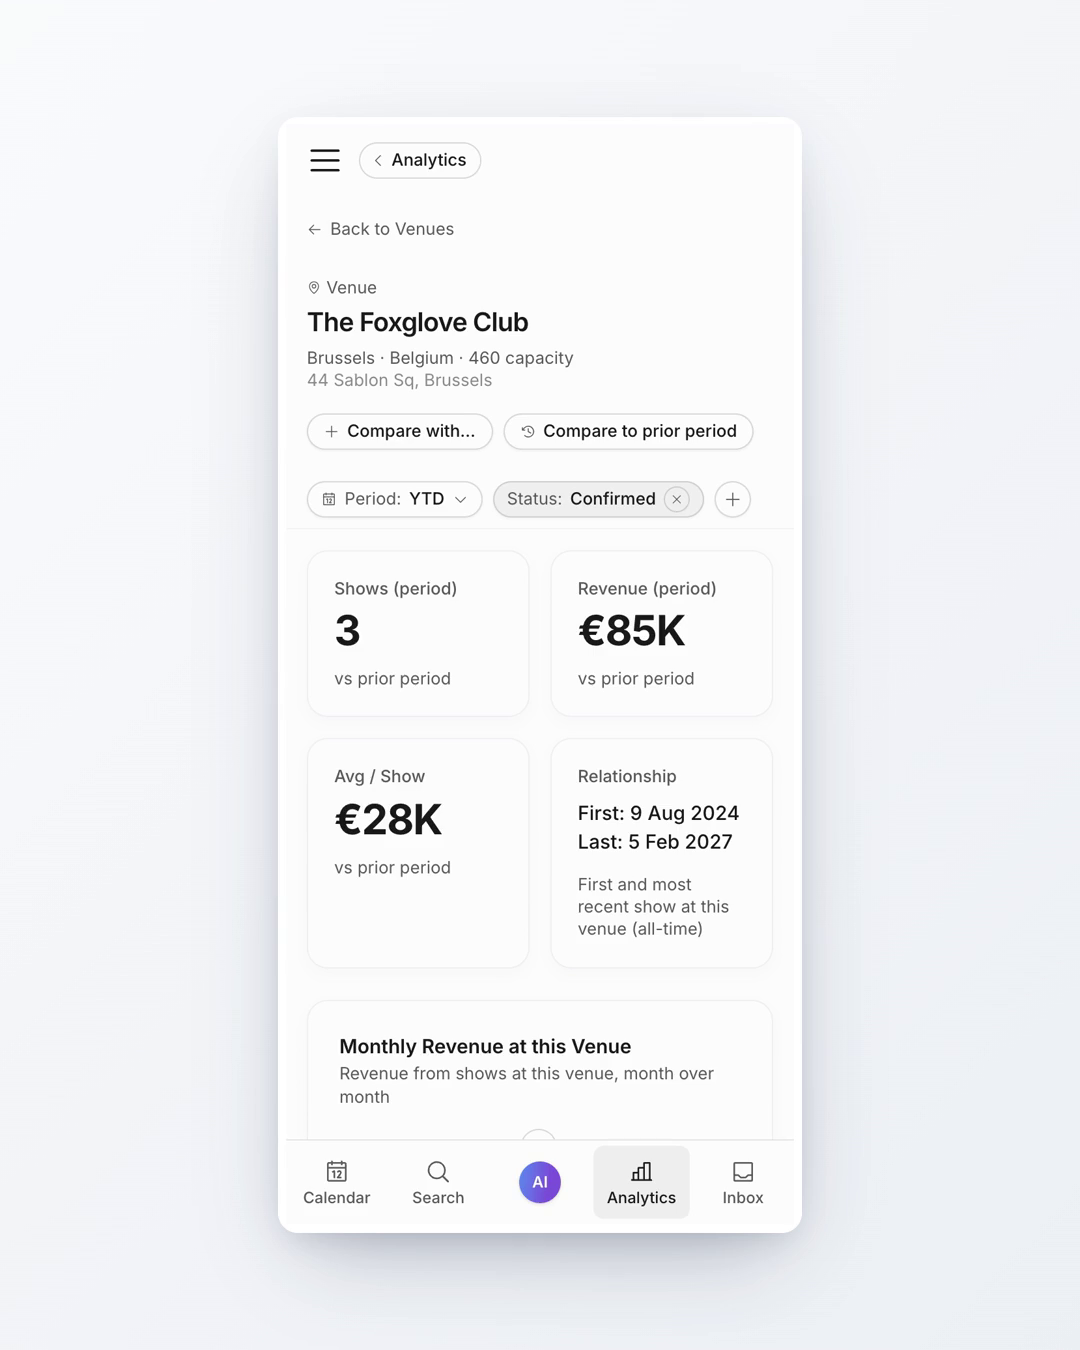
Rows in Analytics are navigation points, not only table entries. Open an artist, venue, city, organizer, or booker to see a narrower view with trends, top lists, and the underlying shows.
Detail pages preserve the same filters and access rules. A detail page is not a separate report with broader data; it is the same analytics lens narrowed to one entity.
The Explore Analytics tutorial walks through the overview, comparison page, booker lens, artist leaderboard, artist drill-down, top venues, and show list. See Guided tutorials.
For the full detail-page and comparison model, see Analytics drilldowns and comparisons.
Make analytics more accurate
Analytics gets better when show records are complete:
- link the correct artist, venue, organizer, and booker on each show;
- keep revenue and expense line items current;
- use real dates and locations;
- choose statuses consistently;
- clear or adopt sample data when you are ready to evaluate only real agency work.
Venue and geographic analytics depend on address-book quality. If a city appears without a map location, re-saving the venue through address autocomplete can add coordinates for better map placement.
Related pages: